Original Articles
Blindness Disparities Between Racial/Ethnic Groups in the State of Texas
Angelica Garcia1, Kent Anderson2, Megan Funkhouser3
doi: http://dx.doi.org/10.5195/ijms.2024.2044
Volume 12, Number 2: 141-145
Received 05 04 2023;
Rev-request 05 06 2023;
Rev-request 19 10 2023;
Rev-recd 30 06 2023;
Rev-recd 01 04 2024;
Accepted 07 06 2024
ABSTRACT
Background:
There are disparities in health outcomes between races. Blindness is associated with
decreased quality of life and negative health outcomes. There is little published
data investigating the difference in the prevalence of blindness between races/ethnicities
nationally and in Texas.
Methods:
This retrospective observational study investigates the differences in crude prevalence
of blindness between different race/ethnicities in Texas. Data was gathered from the
Centers for Disease Control and Prevention (CDC) website Vision and Eye Health Surveillance
System (VEHSS) using the most recently available Compositive Estimate data from the
state of Texas. The variables compared were age groups and race/ethnicity categories
of Black, non-Hispanic, Hispanic, any race and White, non-Hispanic, referred to as
“Black,” “Hispanic,” and “White” respectively. The logs of the relative ratios and
Z scores were used to compare each age group.
Results:
The Black group consistently had the highest crude prevalence of blindness across
age groups; The White group had the lowest prevalence. The Hispanic group consistently
had prevalence rates that were between the Black and White groups. No differences
were found to be statistically significant.
Conclusion:
This data shows that, despite ongoing diversity and inclusion efforts, ongoing inequalities
exist in healthcare outcomes. In the state of Texas, this is made apparent by the
difference in blindness prevalence between Black, Hispanic, and White populations.
These data can be used to bring about change that needs to be addressed at the state
and institutional level.
Introduction
There are disparities that exist between races today in America. This is made evident
by the racial wage gap, recent pushes for cultural awareness, and incorporation of
diversity and inclusion into schools and work places.1,2 In 2021, the American Association of Medical Colleges released a framework addressing
structural racism in academic medicine following the nationwide movement for Black
Lives.3
Healthcare disparities have been defined as “differences in health outcomes that are
closely linked with social, economic and environmental disadvantage.”4 The impact of race, socioeconomic status, education and geographic location on healthcare
has been reported by national and international organizations.5,6 For example, Blacks and Hispanics are less likely to have health insurance than their
Caucasian counterparts.4 Further, even when controlling for income, insurance status,, age, and severity of
incomes, there are persistent racial and ethnic disparities in health care access,
utilization and outcomes.7–11
Vision loss is among the top ten most common disabilities among adults 18 and older.12,13 Vision loss is associated with decreased productivity, decreased quality of life
and negative health outcomes.14–16 Data is lacking in associated outcomes in minorities and older age groups. Studies
have been done globally examining causes of blindness in different age groups and
populations, but few explore the rates of disparities between races and ethnicities.17–19
The purpose of this study is to investigate publicly available data to identify what
disparities, if any, exist in the prevalence of blindness between different racial
and ethnic groups in Texas. Specifically, this study will investigate the prevalence
of blindness by detailed age groups within Black, non-Hispanic, Hispanic, any race
and White, non-Hispanic groups. This is with the goal of awareness and calls for intervention.
Methods
This cross-sectional study was conducted using data gathered from the publicly available
Centers for Disease Control and Prevention (CDC) website Vision and Eye Health Surveillance
System (VEHSS).20 The data used are estimates based on 2017 population, (released May 2021, revised
July 2022) Compositive Estimate data from the state of Texas as of January 2023. Cases
were chosen based on the presence of blindness, cases with vision loss were excluded
in the study. Blindness is defined as “best corrected visual acuity in the better
seeing eye ≤20/200.” Under the category of composite estimates, the Crude Prevalence
Estimates for blindness by detailed age groups was used. The variables compared were
age groups (variable 1) by race/ethnicity (variable 2). Detailed age groups were broken
down into 0–11 years, 12–17 years, 18–24 years, 25–29 years, 30–34 years, 35–39 years,
40–44 years, 45–49 years, 50–54 years, 55–59 years, 60–64 years, 65–69 years, 70–74
years, 75–79 years, 80–84 years, and 85 years and older. Race/Ethnicity groups were
“Black, non-Hispanic”, “Hispanic, any race”, “White, non-Hispanic” and “other.” These
groups will be referred to as “Black”, “Hispanic”, and “White” respectively. For the
purposes of this study, the “other” group was not used due to inadequate comparative
sample size. All genders were included.
The log of the relative ratio of “Hispanic vs White,” “Black vs White” and “Black
vs Hispanic” was used to compare between ethnicities within each age group. Standardized
Z-scores were calculated for contrasts “Black Vs White,” “Hispanic vs White” and “Black
vs Hispanic.” Analyses were conducted within and across age groups. Statistical testing
was two-sided with significance level .05. Analysis was conducted in Rstudio.
Results
A total of 28,304,596 blind patients were identified in the state of Texas for this
study. Of these, 3,336,453 were Black, non-Hispanic, 11,160,514 were Hispanic, any
race and 11,856,625 were White, non-Hispanic. The prevalence for each Race/Ethnicity
by detailed age group is seen in Table 1.
Table 1.
Crude Prevalence of Blindness by Race/Ethnicity in Detailed Age Groups.
| Age |
Black |
Hispanic |
White |
| 0–11 |
0.08 |
0.08 |
0.04 |
| 12–17 |
0.15 |
0.13 |
0.06 |
| 18–24 |
0.20 |
0.15 |
0.08 |
| 25–29 |
0.21 |
0.15 |
0.08 |
| 30–34 |
0.21 |
0.14 |
0.08 |
| 35–39 |
0.22 |
0.14 |
0.09 |
| 40–44 |
0.22 |
0.14 |
0.09 |
| 45–49 |
0.22 |
0.14 |
0.09 |
| 50–54 |
0.23 |
0.14 |
0.09 |
| 55–59 |
0.24 |
0.15 |
0.11 |
| 60–64 |
0.54 |
0.35 |
0.26 |
| 65–69 |
1.04 |
0.68 |
0.54 |
| 70–74 |
1.56 |
1.06 |
0.88 |
| 75–79 |
2.15 |
1.43 |
1.28 |
| 80–84 |
3.33 |
2.45 |
2.32 |
| 85–89 |
7.24 |
5.61 |
6.02 |
The Black group consistently had the highest crude prevalence of blindness across
all age groups. The White group had the lowest prevalence. Crude prevalence in the
Hispanic group was between the black and white groups for all ages. As a general trend,
prevalence of blindness was lowest under the age of 17 and increased with age in all
race/ethnicities, especially after the age of 55. The logarithmic prevalence of each
race/ethnicity for each age group was plotted on a scale in figure 1.
Figure 1.
Logarithmic Prevalence of Blindness by Race/Ethnicity.
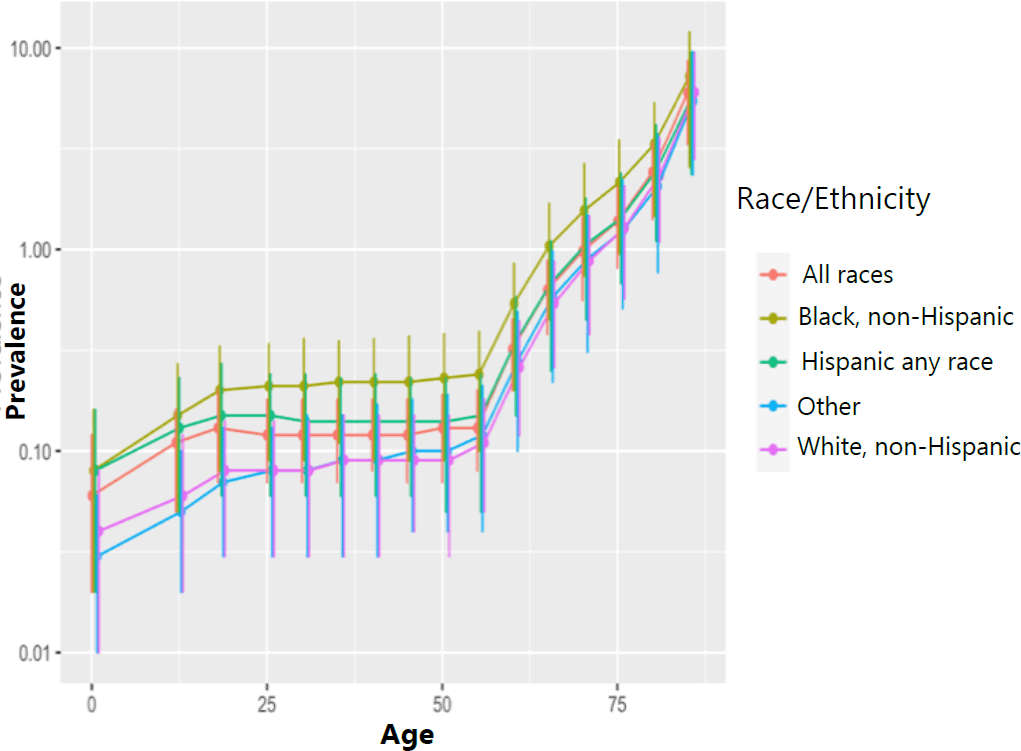
Legend: Logarithmic Prevalence of Blindness by Race/Ethnicity. The prevalence of blindness
is higher in Blacks than Hispanics and Whites. Whites having the lowest prevalence
of the three groups. The logarithmic prevalence relationship seen in figure two reiterates
the relationship in blindness prevalence seen between the Black, Hispanic, and white
groups.
The largest differences in prevalences between the three groups are seen between adults
ages 18–55. The largest difference in blindness prevalence across all age groups was
seen between the Black and White groups. When looking at these two races, the crude
prevalence of blindness was approximately twice as high in blacks as it was in Whites
under the age of 70. Over this age, the Black group maintained a higher prevalence
of blindness when compared to the White group. While these data were striking, none
of these differences were found to be statistically significant. Z scores and P values
are for each age group and ethnicity are found in Figure 2.
Figure 2.
Z scores and P values for Black, Hispanic and White Groups by Detailed Age.
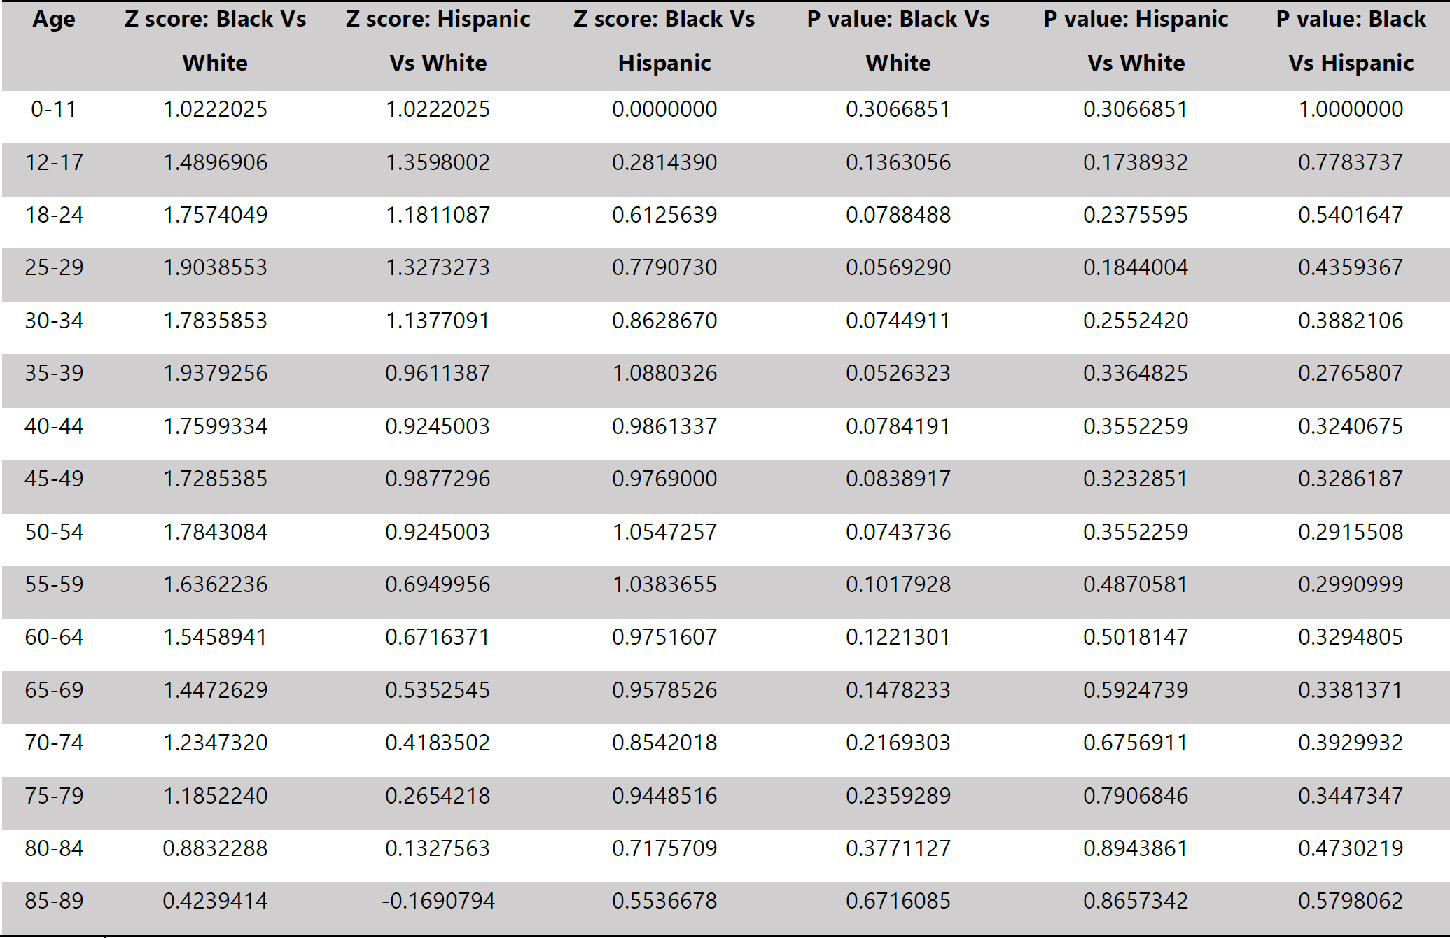
Blindless crude prevalence in the Black group is the highest of the three groups.
This trend is most prevalent in ages 18–55, where the crude prevalence is, on average,
higher than the Hispanic group by 0.8 and higher than the White group by 0.13 (crude
prevalence average for ages 18–50 in Black, Hispanic and White groups is 0.22, 0.14
and 0.09, respectively). Although most prevalent in the aforementioned age group,
the trend is seen across all age groups when compared to Hispanic and White race/ethnicities.
Crude prevalence of blindness in the Hispanic group is consistently lower than the
Black group and higher than the White group. The crude prevalence of blindness was
very similar between Hispanics and Blacks up to age 17. From age groups 18 and up,
the crude prevalence of blindness was higher in the black population than it was in
the Hispanic population per age group. Blindness crude prevalence in the White group
is the lowest overall under the age of 85. In the age group 85–89, the crude prevalence
of blindness is 6.02 in the white group, which is greater than 5.61 in the Hispanic
group.
Discussion
This data review has revealed striking blindness disparities between races in Texas.
These differences highlight how Race and Ethnicity affect patient outcomes. Disparities
lead to decreased quality and efficiency in the healthcare system.5 In fact, a 2009 study estimated excess direct medical care expenditures due to health
inequalities to be $229.4 billion,20 making this an opportunity for saving costs in society. Furthermore, a 2013 study
estimated the economic burden of vision loss and disorders of the eye in people under
the age of 40 to be $27.5 billion.21 This data can contribute to discussions of inequities that are seen in minority patient
populations. These inequalities can further contribute to some minorities' general
mistrust of health care providers, thus leading to decreased medical adherence and
poor patient outcomes.22
The largest disparities in crude prevalence of blindness are seen between the Black
and White groups. Below the age of 75, crude prevalence of blindness is nearly double
when all Black age groups are compared to their White counterparts. While this relationship
is striking, it was not found to be statistically significant; The data closest to
proving statistical significance are age groups 25–29 and 35–39 having p values that
were .057 and .053, respectively. The “Hispanic, any race” group consistently showed
prevalence data that was between that of the Black and White groups. As the largest
minority in Texas, this data highlights the fact that underlying socioeconomic inequities
influence access to vision healthcare services.23–25 This further exacerbates the well-documented pattern that adults with blindness or
visual impairment have self-reported lower access to and use of health care than those
without.13,26 This data is consistent with previous literature showing that there are racial/ethnic
differences in the prevalence of major eye disease that are known to lead to blindness.23,26–30
Of note, the differences in blindness rates were largest in the ages 18–55, which
was the majority of the population in 2017. Therefore the effect of these disparities
was applicable to most adults. It is also important to consider the impact of vision
loss on life expectancy. Vision loss poses many challenges to daily living, increasing
stress past what a person with full vision might experience. Studies have shown a
consistent association between blindness or visual impairment and mortality.30–32 Therefore, it is probable that people with vision impairments aren't living to the
higher ages included in the study. This effect of mortality due to visual impairments
causes a sampling bias in the higher age groups. This can be considered as a reason
for the converging of prevalences seen in all race/ethnicities within the higher age
groups.
Although large strides have been made with respect to diversity and inclusion in healthcare,
this data proves that there are still ongoing inequalities that thwart efforts being
made. There are many social, personal, and economic factors that influence these outcomes.
This data is showing that the state of Texas needs to address these disparities at
the state and institutional level.
Limitations.
First, the blindness prevalence data was taken from one source, the publicly available
CDC website VEHSS. This causes inherent sampling bias despite being a reputable reference.
A future direction will be to use multiple sources to compare reporting and prevalence
of blindness. Secondly, the CDC VEHSS reports prevalence estimates. These estimates
were generated by statistical models from multiple data sources, not reported values.
There were no comments about steps taken to avoid inherent biases that occur in this
type of data reporting. Third, this data is from 2017 and was 5 years old at the time
this study was conducted. Therefore, this data does not consider the impact of recent
racial equality movements improving medical treatments, COVID-19 or political influences
on blindness prevalence.
Summary – Accelerating Translation
There are disparities that exist between races today in America. Healthcare disparities
have been defined as “differences in health outcomes that are closely linked with
social, economic and environmental disadvantage.” The impact of race, socioeconomic
status, education and geographic location on healthcare has been reported by national
and international organizations. Vision loss is associated with decreased productivity,
decreased quality of life and negative health outcomes. Data is lacking in associated
outcomes in minorities and older age groups. Studies have been done globally examining
causes of blindness in different age groups and populations, but few explore the rates
of disparities between races and ethnicities. The purpose of this study is to investigate
publicly available data to identify what disparities, if any, exist in the prevalence
of blindness between different racial and ethnic groups in Texas. Specifically, this
study will investigate the prevalence of blindness by detailed age groups within Black,
non-Hispanic, Hispanic, any race and White, non-Hispanic groups. This is with the
goal of awareness and calls for intervention.
This cross-sectional study was conducted using data gathered from the publicly available
Centers for Disease Control and Prevention (CDC) website Vision and Eye Health Surveillance
System (VEHSS). The data used are estimates based on 2017 population, (released May
2021, revised July 2022) Compositive Estimate data from the state of Texas as of January
2023. Cases were chosen based on the presence of blindness, the Crude Prevalence Estimates
for blindness by detailed age groups was used. The Log of the relative ratio of “Hispanic
vs White,” “Black vs White” and “Black vs Hispanic” was used to compare between ethnicities
within each age group. Standardized Z-scores were calculated for contrasts “Black
Vs White,” “Hispanic vs White” and “Black vs Hispanic.” Analyses were conducted within
and across age groups.
As a general trend, the crude prevalence of blindness was highest in the Black group
and lowest in the White. Hispanic group consistently had a prevalence that was in
between the other two groups. This relationship was best seen between the ages of
18–55. The largest disparities in crude prevalence of blindness are seen between the
Black and White groups. Below the age of 75, crude prevalence of blindness is nearly
double when all Black age groups are compared to their White counterparts. While this
relationship is striking, it was not found to be statistically significant; The data
closest to proving statistical significance are age groups 25–29 and 35–39 having
p values that were .057 and .053, respectively. The “Hispanic, any race” group consistently
showed prevalence data that was between that of the Black and White groups.
Although large strides have been made with respect to diversity and inclusion in healthcare,
this data proves that there are still ongoing inequalities that thwart efforts being
made. There are many social, personal, and economic factors that influence these outcomes.
This data is showing that the state of Texas needs to address these disparities at
the state and institutional level.
Acknowledgments
None
Conflict of Interest Statement & Funding
The Authors have no funding, financial relationships or conflicts of interest to disclose.
Author Contributions
Conceptualization: AG, and KLA. Formal Analysis: AG. Data Curation: AG. Resources:
AG, and MF. Writing – Original Draft: AG. Writing – Review & Editing: AG, KLA, and
MF. Supervision: AG, KLA, and MF. Project Administration: AG, KLA, and MF.
References
1. Berisha E, Dubey RS, Olson E. Monetary policy and the racial wage gap. Empir Econ. 2022;63:3045–9.
2. Hoang T, Suh J, Sabharwal M. Beyond a Numbers Game? Impact of Diversity and Inclusion on the Perception of Organizational
Justice. Public Administration Review. 2022;82(3):537–55.
3. Nguemeni Tiako MJ, Ray V, South EC. Medical Schools as Racialized Organizations: How Race-Neutral Structures Sustain Racial
Inequality in Medical Education—a Narrative Review. J Gen Intern Med. 2022;37(9):2259–66.
4. United States Department of Health and Human Services. HHS Action Plan to Reduce Racial and Ethnic Health Disparities: A Nation Free of Disparities
in Health and Health Care. American Psychological Association. Available from: http://doi.apa.org/get-pedoi.cfm?doi=10.1037/e553842012-001. Cited 2022 Sep 24.
5. 2015 National Healthcare Quality and Disparities Report and 5th Anniversary Update
on the National Quality Strategy. 2015. Available from: http://admin.ahrq.gov/research/findings/nhqrdr/nhqdr15/index.html. cited 2022 Sep 24
6. World Health Organization. Social determinants of health. WHO Regional Office for South-East Asia; 2008. Available from: https://www.who.int/health-topics/social-determinants-ofhealth#tab=tab_1
7. Nelson A. Unequal treatment: confronting racial and ethnic disparities in health care. J Natl Med Assoc. 2002;94(8):666–8.
8. De Lew N, Weinick RM. An Overview: Eliminating Racial, Ethnic, and SES Disparities in Health Care. Health Care Financ Rev. 2000;21(4):1–7.
9. McBean AM, Gornick M. Differences by race in the rates of procedures performed in hospitals for Medicare
beneficiaries. Health Care Financ Rev. 1994;15(4):77–90.
10. Mustard CA, Mayer T, Black C, Postl B. Continuity of Pediatric Ambulatory Care in a Universally Insured Population. Pediatrics. 1996;98(6):1028–34.
11. Schoendorf KC, Hogue CJR, Kleinman JC, Rowley D. Mortality among Infants of Black as Compared with White College-Educated Parents. N Engl J Med. 1992;326(23):1522–6.
12. Centers for Disease Control and Prevention. Burden of Vision Loss | CDC. 2020. Available from: https://www.cdc.gov/visionhealth/risk/burden.htm. cited 2022 Dec 6.
13. Centers for Disease Control and Prevention (CDC). Prevalence of disabilities and associated health conditions among adults–United States,
1999. MMWR Morb Mortal Wkly Rep. 2001;50(7):120–5.
14. Assi L, Chamseddine F, Ibrahim P, Sabbagh H, Rosman L, Congdon N, et al. A Global Assessment of Eye Health and Quality of Life: A Systematic Review of Systematic
Reviews. JAMA Ophthalmology. 2021;139(5):526–41.
15. Hamedani AG, VanderBeek BL, Willis AW. Blindness and Visual Impairment in the Medicare Population: Disparities and Association
with Hip Fracture and Neuropsychiatric Outcomes. Ophthalmic Epidemiol. 2019;26(4):279–85.
16. Lange R, Kumagai A, Weiss S, Zaffke KB, Day S, Wicker D, et al. Visionrelated quality of life in adults with severe peripheral vision loss: a qualitative
interview study. J Patient Rep Outcomes. 2021;5(1):7.
17. Flaxman AD, Wittenborn JS, Robalik T, Gulia R, Gerzoff RB, Lundeen EA, Saaddine J, Rein DB; Vision and Eye Health Surveillance System study group. Prevalence of Visual Acuity Loss or Blindness in the US: A Bayesian Meta-analysis. JAMA Ophthalmol. 2021;139(7):717–723.
18. Kuo PL, Huang AR, Ehrlich JR, Kasper J, Lin FR, McKee MM, Reed NS, Swenor BK, Deal JA. Prevalence of Concurrent Functional Vision and Hearing Impairment and Association
With Dementia in Community-Dwelling Medicare Beneficiaries. JAMA Netw Open. 2021;4(3):e211558.
19. Stevens GA, White RA, Flaxman SR, Price H, Jonas JB, Keeffe J, et al. Global Prevalence of Vision Impairment and Blindness: Magnitude and Temporal Trends,
1990–2010. Ophthalmology. 2013;120(12):2377–84.
20. Centers for Disease Control and Prevention (CDC). 2018. Template Package 4. Available from: https://www.cdc.gov/index.htm. Cited 2024 Jun 28
21. Wittenborn JS, Zhang X, Feagan CW, Crouse WL, Shrestha S, Kemper AR, et al. The Economic Burden of Vision Loss and Eye Disorders among the United States Population
Younger than 40 Years. Ophthalmology. 2013;120(9):1728–35.
22. Halbert CH, Armstrong K, Gandy OH, Shaker L. Racial differences in trust in health care providers. Arch Intern Med. 2006;166(8):896–901.
23. Zhang X, Cotch MF, Ryskulova A, Primo SA, Nair P, Chou CF, et al. Vision Health Disparities in the United States by Race/Ethnicity, Education, and Economic
Status: Findings From Two Nationally Representative Surveys. Am J Ophthalmol. 2012;154(6, Suppl):S53–S62.e1
24. Stein JD, Andrews C, Musch DC, Green C, Lee PP. Sight-Threatening Ocular Diseases Remain Underdiagnosed Among Children Of Less Affluent
Families. Health Affairs. 2016;35(8):1359–66.
25. Unzueta M, Globe D, Wu J, Paz S, Azen S, Varma R, et al. Compliance with recommendations for follow-up care in Latinos: the Los Angeles Latino
Eye Study. Ethn Dis. 2004;14(2):285–91.
26. Cheng Q, Okoro CA, Mendez I, Lundeen EA, Saaddine JB, Stein R, et al. Health Care Access and Use Among Adults With and Without Vision Impairment: Behavioral
Risk Factor Surveillance System, 2018. Prev Chronic Dis. 2022;19:E70.
27. Harris MI, Klein R, Cowie CC, Rowland M, Byrd-Holt DD. Is the Risk of Diabetic Retinopathy Greater in Non-Hispanic Blacks and Mexican Americans
Than in Non-Hispanic Whites With Type 2 Diabetes?: A U.S. population study. Diabetes Care. 1998 Aug 1;21(8):1230–5.
28. Klein R, Chou CF, Klein BEK, Zhang X, Meuer SM, Saaddine JB. Prevalence of Age-Related Macular Degeneration in the US Population. Archives of Ophthalmology. 2011 Jan 10;129(1):75–80
29. West SK, Munoz B, Schein OD, Duncan DD, Rubin GS. Racial Differences in Lens Opacities: The Salisbury Eye Evaluation (SEE) Project. American Journal of Epidemiology. 1998 Dec 1;148(11):1033–9.
30. Wang L, Zhu Z, Scheetz J, He M. Visual impairment and ten-year mortality: the Liwan Eye Study. Eye (Lond). 2021 Aug;35(8):2173–9.
31. Ehrlich JR, Ramke J, Macleod D, Burn H, Lee CN, Zhang JH, et al. Association between vision impairment and mortality: a systematic review and meta-analysis. The Lancet Global Health. 2021 Apr 1;9(4):e418–30.
32. Choi HG, Lee MJ, Lee SM. Mortality and causes of death in a population with blindness in Korea: A longitudinal
follow-up study using a national sample cohort. Sci Rep. 2020 Mar 17;10(1):4891.
Angelica Garcia, 1 BSA, MD. Joe R. and Teresa Lozano Long School of Medicine, University of Texas Health
Science Center at San Antonio, United States.
Kent Anderson, 2 MD, PhD. Department of Ophthalmology, Joe R. and Teresa Lozano Long School of Medicine,
University of Texas Health Science Center at San Antonio, United States.
Megan Funkhouser, 3 OD. Department of Ophthalmology, University of Texas Health Science Center at San
Antonio, United States.
About the Author: Angelica Garcia was a medical student at University of Texas Health Science Center
at San Antonio, United States of a four-year program. She is also a recipient of the
Dr. Robert M. Esterl Jr. Diversity in Medicine, a member of the Minority Ophthalmology
Mentoring Program, and a participant in the Summer Undergraduate Research fellowship
through Dell Medical School.
Correspondence: Angelica Garcia, MD. Address: 7703 Floyd Curl Dr, San Antonio, TX 78229, USA. Email:
angelica.garcia2@utsouthwestern.edu
Editor: Francisco J. Bonilla-Escobar;
Student Editors:Omar Salamanca & Eugenia M. Ramos-Dávila;
Proofreader: Amy Phelan;
Layout Editor: Julián A. Zapata-Rios;
Process: Peer-reviewed
Cite as
Garcia A, Anderson K, Funkhouser M. Blindness Disparities Between Racial/Ethnic Groups
in the State of Texas. Int J Med Stud. 2024 Apr-Jun;12(2):141-145.
Copyright © 2024 Angelica Garcia, Kent Anderson, Megan Funkhouser
This work is licensed under a Creative Commons Attribution 4.0 International License.
International Journal of Medical Students, VOLUME 12, NUMBER 2, June 2024