Original Article
County-Level Food Environment Indices and Diabetes Burden in the United States: An Ecological Cross-Sectional Study
Jeevan Nammi1, Roshini Pasala2
doi: https://doi.org/10.5195/ijms.2026.3560
Volume 14, Number 2: 73-81
Received 12 06 2025; Rev-request 16 03 2026; Rev-request 02 05 2026; Rev-request 16 08 2026; Rev-request 30 08 2026; Rev-request 05 05 2026; Rev-recd 26 03 2026; Rev-recd 06 05 2026; Rev-recd 16 08 2026; Rev-recd 30 08 2026; Rev-recd 05 05 2026; Accepted 14 09 2026
ABSTRACT
Background:
Background: Diabetes remains a major public health challenge in the United States, and structural food environments may contribute to geographic differences in diabetes burden. However, national county-level evidence comparing alternative Retail Food Environment Indices (RFEI) in relation to diabetes prevalence and incidence remains limited. We examined associations between county-level retail food environment indices and diabetes prevalence and incidence in the United States.
Methods:
This ecological cross-sectional study used county-level data from the 2021 CDC Diabetes Surveillance System and the USDA Food Environment Atlas. A total of 2,951 U.S. counties with complete data were included. Primary exposures were the RFEI and expanded variants (RFEI1 and RFEI2), which quantify the relative balance of less healthy and healthier food outlet categories. Primary outcomes were age-adjusted diabetes prevalence and incidence. Pearson correlation coefficients and multivariable linear regression models assessed associations after adjustment for demographic, socioeconomic, behavioral, and food-access covariates. Model diagnostics and sensitivity analyses were performed.
Results:
Higher RFEI values were weakly correlated with diabetes prevalence (r = 0.18) and incidence (r = 0.17). Similar positive correlations were observed for RFEI1 and RFEI2. In adjusted models, RFEI remained significantly associated with diabetes prevalence (β = 0.01, 95% CI 0.00-0.02, p = .004) and incidence (β = 0.07, 95% CI 0.04-0.09, p < .001). Associations were modest.
Conclusion:
Poorer county-level retail food environments were statistically associated with higher diabetes prevalence and incidence. However, effect sizes were small, and findings should be interpreted as hypothesis-generating county-level associations rather than evidence of individual-level risk or causality.
Introduction
Diabetes mellitus, particularly type 2 diabetes (T2DM), continues to pose a major public health challenge in the United States. As of 2021, an estimated 38.4 million people of all ages, or 11.6% of the U.S. population, had diabetes.1,2 Among adults aged 18 and older, the prevalence was even higher at 14.7%, with a disproportionate burden observed in older adults; nearly 3 in 10 adults aged 65 or above were living with the disease.1–3 Additionally, 8.7 million adults met laboratory criteria for diabetes but were unaware or undiagnosed, reflecting a gap in disease recognition and management. That same year, approximately 1.2 million new cases of diabetes were diagnosed among adults, reinforcing the continuing and widespread nature of the epidemic.1,3,4
Multiple risk factors contribute to the development of T2DM. Some are non-modifiable, such as family history, age, race or ethnicity, and a history of gestational diabetes, factors that can increase susceptibility regardless of lifestyle. Others are modifiable and offer opportunities for prevention.5,6 These include excess body weight, physical inactivity, high blood pressure, smoking, and dietary patterns.5-7 While individual lifestyle factors remain important, there is increasing recognition of the role of structural and environmental determinants of health, including the availability and accessibility of healthy foods.8-10
Many communities, particularly in low-income and underserved areas, experience an imbalance in their food environments, with limited access to supermarkets or farmers markets and greater exposure to fast-food outlets and convenience stores.11-14 These environments, often described as "food deserts" or "food swamps," are thought to influence dietary behaviors and long-term cardiometabolic outcomes.12–14 However, these constructs remain simplifications of complex food systems and may not fully capture food quality, affordability, or purchasing behavior.
To quantify local food environments, the Retail Food Environment Index (RFEI) has been widely used as an outlet-based structural measure comparing the relative density of less healthy and healthier food retailers.15,16 Higher RFEI values indicate a greater concentration of fast-food restaurants and convenience stores relative to grocery stores. Despite its widespread use, the conventional RFEI may oversimplify local food access, particularly because the classification of certain outlet types, such as supercenters, remains context dependent.
To address this limitation, we examined two expanded variants, RFEI1 and RFEI2, which apply different assumptions regarding the classification of supercenters and include additional food retail categories. Supercenters may function as sources of affordable groceries in some communities while also increasing access to energy-dense processed foods in others. Therefore, evaluating alternative RFEI specifications may provide a more nuanced assessment of the association between retail food environments and health outcomes.
Although ecological and neighborhood-level studies have linked food environments to dietary behavior, obesity, and cardiometabolic outcomes, fewer national county-level analyses have systematically compared alternative RFEI specifications in relation to both diabetes prevalence and incidence.15,16 This distinction is important because different index constructions may yield different inferences regarding the role of the food environment as a structural correlate of disease burden.
Therefore, this study aimed to examine the association between county-level retail food environment indices and diabetes prevalence and incidence across U.S. counties. We also assessed whether these associations were consistent across alternative RFEI specifications that differ in the classification of supercenters and healthier food retail outlets. Given the ecological and cross-sectional design, this study was intended to generate population-level hypotheses rather than establish individual-level risk or causal effects.
Methods
Study Design and Data Sources
This ecological cross-sectional study used publicly available county-level data from the United States. The primary outcomes were age-adjusted diabetes prevalence (%) and diabetes incidence (new cases per 1,000 adults), obtained from the CDC Diabetes Surveillance System (2021).3 Food environment measures, including the Retail Food Environment Index (RFEI) and its expanded variants (RFEI1 and RFEI2), as well as county-level demographic, socioeconomic, behavioral, and food-access covariates, were obtained from the USDA Food Environment Atlas using the most recent available measures for each indicator in the dataset release.17
All datasets were merged using the standardized five-digit Federal Information Processing Standard (FIPS) county codes.18 This study was reported in accordance with the STROBE guideline for observational studies.19
Because the unit of analysis was the county, all exposures, outcomes, and covariates were analyzed as aggregate county-level measures. No individual-level data were included, and all findings were interpreted as ecological associations rather than individual-level relationships.
Study Counties
The initial dataset included all 3,141 U.S. counties and county equivalents available in the merged source files. Counties were included in the final analysis if complete data were available for all exposure, outcome, and covariate variables used in the regression models. Counties were excluded if one or more required variables were missing. A total of 190 counties were excluded, resulting in a final complete-case analytic sample of 2,951 counties.
A complete-case analytic approach was used, and no imputation was performed. Potential bias from missing data was evaluated by comparing included and excluded counties descriptively, where data were available.
Exposure Variables
The primary exposure of interest was the Retail Food Environment Index (RFEI), an outlet-based measure comparing the relative availability of food outlet categories typically classified as less healthy with those classified as healthier retail food sources. The standard RFEI was calculated as the ratio of fast-food restaurants and convenience stores to grocery stores. RFEI1 was calculated using fast-food restaurants, convenience stores, and supercenters in numerator and grocery stores, farmers markets, and specialized food stores in the denominator. RFEI2 was calculated using fast-food restaurants and convenience stores in the numerator andgrocery stores, farmers markets, specialized food stores, and supercenters in the denominator. Thus, RFEI1 treats supercenters as part of the less favorable food outlet environment, whereas RFEI2 treats supercenters as part of healthier food access.
RFEI = (fast food restaurants + convenience stores) ÷ grocery stores
RFEI1 = (fast food restaurants + convenience stores + supercenters) ÷ (grocery stores + farmers markets + specialized stores)
RFEI2 = (fast food restaurants + convenience stores) ÷ (grocery stores + farmers markets + specialized stores + supercenters)
The distinction between RFEI1 and RFEI2 reflects uncertainty in the classification of supercenters. In some settings, supercenters may improve access to affordable groceries, while in others, they may increase access to highly processed foods. Therefore, RFEI1 classifies supercenters as less favorable outlets, whereas RFEI2 classifies them as part of the healthier food access denominator. For all indices, higher values indicate a less favorable retail food environment.
Counties with undefined index values due to zero denominators were coded as missing and excluded from index-specific analyses.
Outcome Variables and Covariates
The primary outcomes were county-level age-adjusted diabetes prevalence, defined as the percentage of adults with diagnosed diabetes, and age-adjusted diabetes incidence, defined as the number of newly diagnosed cases per 1,000 adults.
Covariates included county-level demographic, socioeconomic, behavioral, and food-access characteristics. Demographic variables included percentages of racial and ethnic groups (White, Black, Hispanic, Asian, American Indian or Alaska Native, and Native Hawaiian or Pacific Islander). Socioeconomic variables included median household income, poverty rate, SNAP participation, and food insecurity. Behavioral variables included obesity prevalence and physical inactivity prevalence. Food-access context was represented by the percentage of Food-access context was represented by the percentage of grocery access to the residents
All covariates were analyzed as continuous variables. Percentage variables were interpreted per one-percentage-point increase unless otherwise specified. Median household income was analyzed in its original scale, and units for all variables were defined in the regression table footnotes.
Statistical Analysis
All analyses were performed using R software (version 4.5.0) with relevant statistical packages for regression modelling, diagnostics and visualization.
Descriptive statistics were calculated for all variables. Continuous variables were summarized using means and standard deviations. Pearson correlation coefficients were used to assess unadjusted associations between food environment indices and diabetes outcomes.
County-level diabetes prevalence and incidence were analyzed as continuous outcomes using linear regression models. Linear regression was selected because the outcomes represent aggregated county-level rates rather than individual-level binary outcomes. Although diabetes prevalence is bounded between 0 and 100, observed values were not near boundary extremes, supporting the use of linear models for ecological interpretation.
Univariate linear regression models were first used to examine the association of RFEI, RFEI1, RFEI2 with diabetes outcomes. Multivariable linear regression models were then constructed using RFEI as the primary exposure, adjusting for demographic, socioeconomic, behavioral, and food-access covariates.
To avoid multicollinearity among race variables, the percentage of White population was treated as the implicit reference and excluded from the multivariable model.
A complete-case analytic approach was used and no imputation was performed.
Model Diagnostics
Model assumptions were evaluated using multiple diagnostic approaches. Residual-versus-fitted plots were used to assess linearity and variance patterns, and Q–Q plots were used to assess residual normality. Heteroscedasticity was formally tested using the Breusch–Pagan test. Influential observations were identified using Cook’s distance, with a threshold of 4/n. Multicollinearity was assessed using variance inflation factors (VIF).
Sensitivity Analyses
Several sensitivity analyses were conducted to evaluate robustness. First, regression models were repeated using heteroscedasticity-robust standard errors (HC3). Second, models were repeated using log-transformed RFEI [log(RFEI + 1)] to address skewness. Third, analyses were repeated after excluding influential observations identified by Cook’s distance. Finally, alternative exposure specifications using RFEI1 and RFEI2 were evaluated in adjusted models.
Exploratory interaction analyses between RFEI and poverty rate were also performed to assess potential effect modification, with results interpreted cautiously. Statistical significance was assessed using two-sided p-values, with p < 0.05 considered statistically significant. Given the large sample size, statistical significance was interpreted alongside effect size and confidence intervals rather than as evidence of substantive importance.
Potential Sources of Bias
Several sources of bias were considered in the design and interpretation of this study. First, because the analysis was ecological and county-level, observed county-level associations may not reflect individual-level relationships. Second, outlet-based food environment indices may misclassify the nutritional context of communities because they do not capture food quality, affordability, in-store product availability, or consumer purchasing behavior. Third, the complete-case approach may introduce selection bias if excluded counties differed systematically from included counties. Finally, residual confounding is possible because not all relevant structural or individual-level determinants of diabetes could be measured. Residual confounding, ecological fallacy, and exposure misclassification related to outlet-based indices were considered in interpretation:
Results
Data Completeness
Of the 3,141 U.S. counties and county equivalents in the initial dataset, 2,951 counties had complete data for all exposure, outcome, and covariate variables required for analysis. Counties with incomplete data were excluded, resulting in the removal of 190 counties from the final analytic sample.
Missingness was primarily observed in food environment indices and selected covariates. A complete-case analytic approach was retained because the proportion of excluded counties was relatively small; however, the possibility of selection bias cannot be excluded. Because excluded counties were missing one or more required exposure, outcome, or covariate variables, a complete side-by-side comparison was limited by data availability. However, the complete-case sample retained 2,951 of 3,141 counties and county equivalents, representing most counties in the national dataset. Therefore, while selection bias cannot be fully excluded, the analytic sample preserved broad national county-level coverage.
Table 1.Descriptive Characteristics of U.S. Counties Included in the Analysis (N = 2,951)
Legend: RFEI = Retail Food Environment Index. "RFEI1 and RFEI2 represent expanded food environment specifications differing in supercenters classification." with "RFEI1 includes supercenters in the numerator as less favorable food outlets, whereas RFEI2 includes them in the denominator as healthier retail food sources. These classifications reflect alternative analytical assumptions rather than definitive assessments of supercenter food quality."
Descriptive Analysis
A total of 2,951 U.S. counties with complete data were included in the descriptive analysis. The mean Retail Food Environment Index (RFEI) was 6.76 ± 4.37, indicating that counties had, on average, substantially greater availability of fast-food restaurants and convenience stores relative to grocery stores. The expanded variants showed lower mean values, with RFEI1 = 4.50 ± 2.73 and RFEI2 = 4.03 ± 2.26, reflecting differences in index construction related to supercenters and additional food retail categories.
The mean age-adjusted diabetes prevalence across counties was 8.59%, while the mean diabetes incidence rate was 9.36 cases per 1,000 adults. Diabetes prevalence was higher among males than among females. Descriptive statistics for food environment indices, diabetes outcomes, and covariates are presented in Table 1.
Correlation Analysis
Pearson correlation coefficients were calculated to assess unadjusted bivariate relationships between food environment indices and diabetes outcomes. The standard Retail Food Environment Index (RFEI) demonstrated weak but positive correlations with both diabetes prevalence (r = 0.18) and diabetes incidence (r = 0.17). The expanded indices showed slightly stronger but still modest positive correlations. RFEI1 was correlated with diabetes prevalence (r = 0.23) and diabetes incidence (r = 0.24), whereas RFEI2 was correlated with diabetes prevalence (r = 0.22) and diabetes incidence (r = 0.25). Although statistically significant, these correlations demonstrated low explanatory strength, suggesting that food environment indices alone accounted for only a small proportion of variation in county-level diabetes burden. Sex-specific prevalence correlations were removed from the primary analysis because no formal effect-modification testing by sex was performed. Correlation results are presented in Figure 1.
Table 2.Univariate Linear Regression Analyses of Food Environment Indices and Diabetes Outcomes
Legend: β coefficients represent unadjusted linear regression estimates. Diabetes prevalence is expressed in percentage points. Diabetes incidence is expressed as cases per 1,000 adults.
Univariate Regression Analysis
Univariate linear regression analyses demonstrated statistically significant positive associations between all food environment indices and both diabetes prevalence and diabetes incidence. For diabetes prevalence, RFEI was associated with a 0.06 percentage-point increase in prevalence per one-unit increase in index value (β = 0.06, p < .001). Similarly, RFEI1 and RFEI2 demonstrated positive associations with diabetes prevalence. For diabetes incidence, RFEI was associated with a 0.13 case-per-1,000-adults increase in incidence (β = 0.13, p < .001). Similar positive associations were observed for RFEI1 and RFEI2. However, unadjusted R2 values were low across models, indicating weak explanatory power despite statistical significance. Detailed univariate regression results are presented in Table 2.
Figure 1.Pearson Correlations between Food Environment Indices and Diabetes Outcomes
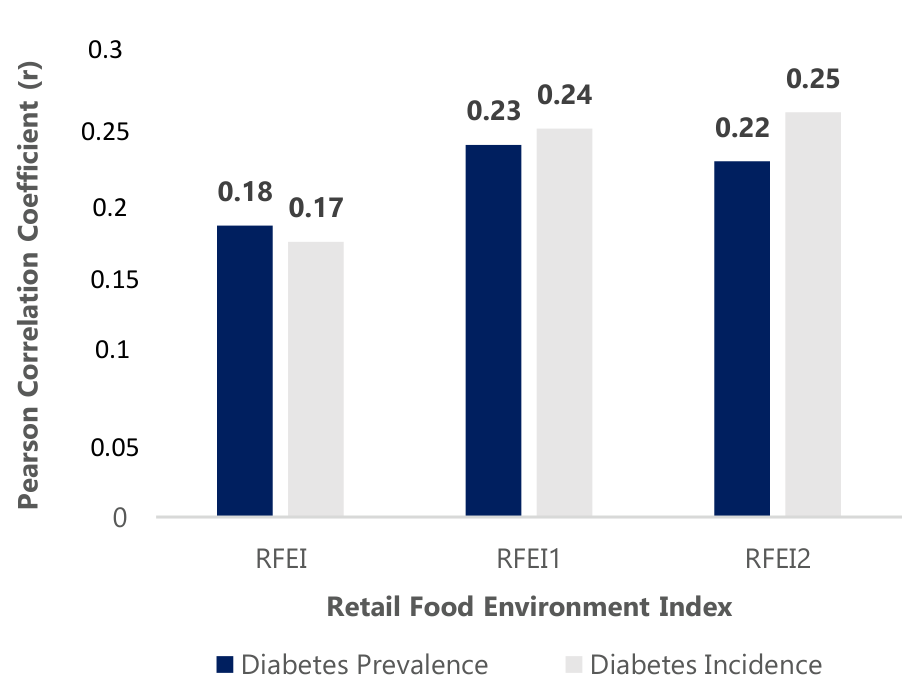
Legend: RFEI = Retail Food Environment Index. RFEI1 and RFEI2 represent alternative food environment specifications differing in the classification of supercenters and healthier food retail outlets.
Table 3.Multivariable Linear Regression Models for Diabetes Prevalence and Incidence
Legend: β coefficients represent adjusted linear regression estimates. Diabetes prevalence is expressed as a percentage-point change. Diabetes incidence is expressed as cases per 1,000 adults. The percentage of the White population was excluded from multivariable models as the implicit reference category to reduce multicollinearity among race variables. Median household income 10000 USD; therefore, regression coefficients appear numerically small because they represent per-dollar increases.
Multivariable Regression Analysis
Multivariable linear regression analyses were conducted to evaluate the associations between the Retail Food Environment Index (RFEI) and diabetes outcomes after adjustment for county-level demographic, socioeconomic, behavioral, and food-access covariates. In the adjusted diabetes prevalence model, each one-unit increase in RFEI was associated with a 0.01 percentage-point increase in diabetes prevalence (β = 0.01, 95% CI 0.00–0.02, p = .004). In the adjusted diabetes incidence model, each one-unit increase in RFEI was associated with a 0.07 case-per-1,000-adults increase in diabetes incidence (β = 0.07, 95% CI 0.04–0.09, p < .001).
Among covariates, physical inactivity, SNAP participation, and the percentage of Black population were significantly associated with both diabetes outcomes. Obesity prevalence was significantly associated with diabetes prevalence (p < .001), but not incidence (p = .62). The adjusted prevalence model explained approximately 66% of the variance in diabetes prevalence, whereas the adjusted incidence model explained approximately 37% of the variance in diabetes incidence. These adjusted R2 values reflect the combined contribution of demographic, socioeconomic, behavioral, and food-access covariates and should not be interpreted as the proportion of variance explained by RFEI alone. Although RFEI remained statistically significant after adjustment, the magnitude of association was modest in absolute terms. Adjusted multivariable regression results are summarized in Table 3.
Table 4.Regression Diagnostic Assessment
Legend: VIF = Variance inflation factor.
Influential counties were identified using Cook’s distance threshold of 4/n
Table 5.Sensitivity Analyses of the Association Between Food Environment Indices and Diabetes Outcomes
Legend: These findings indicate that the direction of association was not dependent on a single analytic specification. Robust standard errors were estimated using HC3 heteroscedasticity-consistent estimators.
Model Diagnostics
Model diagnostic analyses were performed to assess the assumptions and stability of the linear regression models. Residual-versus-fitted plots demonstrated mild heteroscedasticity, particularly at lower fitted values. Q-Q plots showed approximate normality of residuals with mild tail deviation. The Breusch-Pagan test demonstrated evidence of heteroscedasticity in both the diabetes prevalence model (p < .001) and diabetes incidence model (p < .001). Multicollinearity assessment demonstrated acceptable VIF values, with a maximum VIF below commonly accepted thresholds for severe collinearity. Cook’s distance analysis identified potentially influential counties in both models. However, exclusion of influential observations did not meaningfully alter the direction or statistical significance of the primary findings. Diagnostic findings are summarized in Table 4.
Sensitivity Analyses
Several sensitivity analyses were performed to evaluate the robustness of the primary findings. In models using heteroscedasticity-robust standard errors, the association between RFEI and diabetes prevalence remained directionally consistent (β = 0.01, 95% CI 0.00 to 0.02), and the association with diabetes incidence remained positive (β = 0.07, 95% CI 0.06 to 0.08). Models using log-transformed RFEI [log(RFEI + 1)] also demonstrated positive associations with diabetes prevalence (β = 0.14, 95% CI 0.07 to 0.21) and diabetes incidence (β = 0.60, 95% CI 0.40 to 0.81). After excluding influential counties identified using Cook’s distance, RFEI remained positively associated with diabetes prevalence (β= 0.01, 95% CI 0.01 to 0.02) and diabetes incidence (β = 0.06, 95% CI 0.04 to 0.08). Adjusted models using RFEI1 and RFEI2 also showed directionally consistent positive associations with both outcomes. Overall, these sensitivity analyses suggest that the observed county-level associations were modest but generally robust across alternative model specifications. Sensitivity analysis results are presented in Table 5. These findings indicate that the direction of association was not dependent on a single analytic specification.
Discussion
This national county-level ecological study found that less favourable retail food environments were associated with higher diabetes prevalence and incidence across U.S. counties. Although these associations were statistically significant, their magnitude was modest, and the unadjusted correlations demonstrated limited explanatory strength. Therefore, the findings should be interpreted as hypothesis-generating ecological associations rather than evidence that food retail environments independently or causally determine diabetes risk.
The positive correlations observed between food environment indices and diabetes outcomes were weak but directionally consistent across RFEI, RFEI1, and RFEI2. This consistency across alternative specifications suggests that the observed associations were not solely dependent on a single operational definition of the retail food environment. However, the relatively small effect sizes indicate that food environment indices likely represent only one component of a broader structural and socioeconomic context associated with diabetes burden.
In adjusted analyses, RFEI remained significantly associated with both diabetes prevalence and diabetes incidence after accounting for demographic, socioeconomic, behavioural, and food-access covariates. Although RFEI remained significantly associated with both diabetes outcomes, its estimated associations were modest. Other county-level factors, including physical inactivity, SNAP participation, and the percentage of Black population, were also significantly associated with both outcomes, whereas obesity prevalence was associated with diabetes prevalence but not incidence. Because these predictors were measured on different scales, their unstandardized coefficients should not be directly compared to determine relative association strength. An important consideration in interpreting these findings is the distinction between statistical significance and substantive significance. Given the large number of U.S. counties included in the analysis, the study had substantial statistical power to detect relatively small associations. Therefore, statistical significance should not be interpreted as evidence of strong predictive or causal importance. Instead, the findings indicate that less favorable food environments may coexist with broader patterns of structural disadvantage associated with diabetes burden. From a practical public health perspective, these findings should be viewed as a signal for identifying structurally disadvantaged places and prioritizing further longitudinal evaluation, rather than as an estimate of the effect of any single food-environment intervention.
These findings are generally consistent with prior studies linking local food environments to obesity, dietary behaviour, and cardiometabolic outcomes.20-24 Previous research has suggested that communities with greater relative access to fast-food outlets and convenience stores may experience less favourable dietary patterns and increased chronic disease burden.20-22 At the same time, the current findings extend prior literature by demonstrating that these associations remain directionally consistent across multiple RFEI specifications at the national county level.
Our analysis of RFEI1 and RFEI2 demonstrated slightly stronger unadjusted correlations with diabetes outcomes than the standard RFEI. These findings may reflect differences in how supercenters and expanded food outlet categories are classified within the indices. However, stronger correlations should not be interpreted as evidence that one specification is definitively superior. Rather, the comparison of RFEI variants should be viewed as an exploratory robustness assessment.
Importantly, RFEI and its expanded variants remain simplified outlet-based structural proxies rather than direct measures of nutritional exposure. These indices do not capture food affordability, food quality, in-store product availability, transportation access, cultural dietary practices, purchasing behaviour, or individual dietary intake. Consequently, exposure misclassification is possible, and the observed associations should be interpreted within the limitations of ecological food environment measures. County-level socioeconomic context also appeared strongly associated with diabetes outcomes in adjusted analyses. Median household income demonstrated an inverse relationship with diabetes burden, whereas poverty-related indicators and SNAP participation demonstrated positive associations. These findings are consistent with broader literature suggesting that structural disadvantage, socioeconomic inequality, and chronic disease burden are closely interconnected.14, 25-27
The relatively high adjusted R2 values observed in multivariable models should also be interpreted cautiously. These values likely reflect the combined explanatory contribution of multiple correlated demographic, socioeconomic, behavioural, and food-access variables rather than the independent contribution of RFEI itself. Ecological covariates frequently cluster geographically and socially, and therefore, the adjusted models are best interpreted as conditional association models rather than causal explanatory models.
The distinction between diabetes prevalence and incidence is also relevant when interpreting these findings. Prevalence reflects not only disease occurrence but also survival, diagnosis patterns, and population composition, whereas incidence more directly reflects new case occurrence. The fact that less favourable food environments were associated with both outcomes in the same direction strengthens the overall consistency of the observed pattern, although these outcomes should not be interpreted as reflecting identical mechanisms.
The presence of heteroscedasticity and influential observations further underscores the importance of cautious interpretation in ecological regression analyses. However, the direction and statistical significance of the primary findings remained generally consistent across robust standard error models, log-transformed exposure models, exclusion of influential counties, and alternative RFEI specifications, supporting the overall robustness of the observed associations despite their modest magnitude.
Taken together, these findings support the relevance of the county-level food retail environment as one component of the broader structural context associated with diabetes burden. However, these findings should not be interpreted as direct evidence that modifying retail food environments alone would reduce diabetes prevalence or incidence. Future longitudinal, multilevel, and quasi-experimental studies are needed to determine whether changes in food environments are followed by meaningful changes in diabetes-related outcomes after accounting for broader social and structural determinants of health.
Limitations
This study has several limitations. First, the ecological cross-sectional design precludes causal inference and does not establish temporality between the food environment and diabetes burden. Second, because analyses were conducted at the county level, the findings are subject to ecological fallacy and should not be interpreted as evidence that individuals living in counties with higher RFEI values necessarily experienced poorer diets or developed diabetes because of the local food environment.
Third, county-level averages may obscure substantial within-county heterogeneity, particularly in geographically large counties containing diverse urban and rural populations. In addition, counties are large and heterogeneous geographic units, and residents may obtain food, healthcare, and other services across county boundaries. Therefore, county-level RFEI values may not accurately represent the food environment experienced by all individuals within a county. Fourth, RFEI and its expanded variants are outlet-based structural proxies and do not capture food quality, affordability, transportation access, in-store product availability, purchasing behaviour, or individual dietary intake. Therefore, exposure misclassification is possible.
Fifth, although models adjusted for multiple demographic, socioeconomic, behavioural, and food-access variables, residual confounding remains likely. Important unmeasured factors such as healthcare access, insurance coverage, educational attainment, diabetes screening intensity, diagnostic practices, medication access, family history, and individual-level socioeconomic characteristics were unavailable. These factors may influence county-level diabetes prevalence and incidence independently of the retail food environment.
Sixth, several ecological covariates were moderately correlated with one another. Although multicollinearity diagnostics were acceptable, the adjusted models should be interpreted as conditional association models rather than causal models estimating total effects.
Seventh, the complete-case analytic approach may have introduced selection bias if excluded counties differed systematically from included counties. Finally, evidence of heteroscedasticity and influential observations was identified in regression diagnostics. Although sensitivity analyses demonstrated generally consistent findings, these issues remain important limitations of ecological modelling approaches.
Conclusion
In this national county-level ecological study, less favorable retail food environments were statistically associated with higher diabetes prevalence and incidence. However, the observed associations were modest in magnitude and should be interpreted as hypothesis-generating ecological findings rather than evidence of individual-level risk or causality.
RFEI may function as a structural contextual marker associated with broader patterns of disadvantage rather than as an independent determinant of diabetes burden. Future longitudinal, multilevel, spatially refined, and quasi-experimental studies are needed to determine whether changes in retail food environments are followed by meaningful changes in individual level diabetes risk and population level diabetes burden.
Conflict of Interest Statement & Funding
The Authors have no funding, financial relationships or conflicts of interest to disclose.
Author Contributions
Conceptualization: J.N, R.P. Data Curation: J.N, R.P. Formal Analysis: J.N, R.P. Investigation: J.N, R.P. Methodology: J.N, R.P. Project Administration: J.N, R.P. Software: J.N, R.P. Supervision: J.N. Validation: J.N, R.P. Visualization: J.N, R.P. Writing - Original Draft: J.N, R.P. Writing - Review & Editing: J.N, R.P.
References
1. Centers for Disease Control and Prevention. National Diabetes Statistics Report. CDC; 2024 [cited 2025 May 22]. Available from: https://www.cdc.gov/diabetes/php/data-research/index.html
2. American Diabetes Association. Diabetes statistics. ADA; 2024 [2025 May 22]. Available from: https://diabetes.org/about-diabetes/statistics/about-diabetes
3. Centers for Disease Control and Prevention. United States Diabetes Surveillance System. CDC; 2024 [cited 2025 May 22]. Available from: https://gis.cdc.gov/grasp/diabetes/diabetesatlas-surveillance.html
4. Wagenknecht LE, Lawrence JM, Isom S, Divers J, Imperatore G, Pihoker C, et al. Trends in incidence of youth-onset type 1 and type 2 diabetes in the USA, 2002–18: results from the population-based SEARCH for Diabetes in Youth study. Lancet Diabetes Endocrinol. 2023;11(4):242-50.
5. American Heart Association. Diabetes risk factors. AHA; 2024 [cited 2025 May 22]. Available from: https://www.heart.org/en/health-topics/diabetes/understand-your-risk-for-diabetes
6. World Health Organization. Diabetes. WHO; 2024 [cited 2025 May 22]. Available from: https://www.who.int/news-room/fact-sheets/detail/diabetes
7. Ismail L, Materwala H, Al Kaabi J. Association of risk factors with type 2 diabetes: a systematic review. Comput Struct Biotechnol J. 2021;19:1759-85.
8. County Health Rankings & Roadmaps. Food Environment Index [Internet]. University of Wisconsin Population Health Institute; 2025 [cited 2025 May 21]. Available from: https://www.countyhealthrankings.org/health-data/community-conditions/health-infrastructure/health promotion-and-harm-reduction/food-environment-index
9. Rideout K, Mah CL, Minaker L. Food environments: an introduction for public health practice. Vancouver (BC): National Collaborating Centre for Environmental Health; 2015.
10. Downs SM, Ahmed S, Fanzo J, Herforth A. Food environment typology: advancing an expanded definition, framework, and methodological approach for improved characterization of wild, cultivated, and built food environments toward sustainable diets. Foods. 2020;9(4):532.
11. United States Department of Agriculture Economic Research Service. Food security in the U.S.: key statistics and graphics. USDA; 2024 [cited 2025 May 21]. Available from: https://www.ers.usda.gov/topics/food-nutrition-assistance/food-security-in-the-us/key-statistics-graphics
12. Parker ED, Lin J, Mahoney T, Ume N, Yang G, Gabbay RA, et al. Economic costs of diabetes in the U.S. in 2022. Diabetes Care. 2024;47(1):26-43.
13. United States Department of Agriculture Economic Research Service. Characteristics and influential factors of food deserts. USDA; 2009 [cited 2025 May 21]. Available from: https://www.ers.usda.gov/publications/pub-details/?pubid=45017
14. Walker RE, Keane CR, Burke JG. Disparities and access to healthy food in the United States: a review of food deserts literature. Health Place. 2010;16(5):876-84.
15. Pineda E, Stockton J, Mindell JS. The Retail Food Environment Index and its association with dietary patterns, body mass index, and socioeconomic position: a multilevel assessment in Mexico. PLOS Glob Public Health. 2024;4(10):e0003819.
16. Glover B, Mao L, Hu Y, Zhang J. Enhancing the Retail Food Environment Index (RFEI) with neighborhood commuting patterns: a hybrid human-environment measure. Int J Environ Res Public Health. 2022;19(17):10798.
17. United States Department of Agriculture Economic Research Service. Food Environment Atlas: data access and documentation downloads. USDA; 2024 [cited 2025 May 21]. Available from: https://www.ers.usda.gov/data-products/food-environment-atlas/data-access-and-documentation-downloads.
18. Opendatasoft. Counties - United States of America. Opendatasoft; 2024 [cited 2025 May 22]. Available from: https://public.opendatasoft.com/explore/dataset/georef-united-states-of-america-county.
19. von Elm E, Altman DG, Egger M, Pocock SJ, Gøtzsche PC, Vandenbroucke JP; STROBE Initiative. The Strengthening the Reporting of Observational Studies in Epidemiology (STROBE) statement: guidelines for reporting observational studies. J Clin Epidemiol. 2008;61(4):344-9.
20. Franco M, Diez Roux AV, Glass TA, Caballero B, Brancati FL. Neighborhood characteristics and availability of healthy foods in Baltimore. Am J Prev Med. 2008;35(6):561-7.
21. Zenk SN, Lachance LL, Schulz AJ, Mentz G, Kannan S, Ridella W. Neighborhood retail food environment and fruit and vegetable intake in a multiethnic urban population. Am J Health Promot. 2009;23(4):255-64.
22. Levi R, Bleich SN, Seligman HK. Food insecurity and diabetes: overview of intersections and potential dual solutions. Diabetes Care. 2023;46(9):1599-1608.
23. Liese AD, Weis KE, Pluto D, Smith E, Lawson A. Food store types, availability, and cost of foods in a rural environment. J Am Diet Assoc. 2007;107(11):1916-23.
24. Morland K, Wing S, Diez Roux A, Poole C. Neighborhood characteristics associated with the location of food stores and food service places. Am J Prev Med. 2002;22(1):23-9.
25. Popkin BM, Adair LS, Ng SW. Global nutrition transition and the pandemic of obesity in developing countries. Nutr Rev. 2012;70(1):3-21.
26. Malik VS, Willett WC, Hu FB. Global obesity: trends, risk factors and policy implications. Nat Rev Endocrinol. 2013;9(1):13-27.
27. Drewnowski A, Specter SE. Poverty and obesity: the role of energy density and energy costs. Am J Clin Nutr. 2004;79(1):6-16.
Jeevan Nammi, 1 MBBS, MPH(C). University of Alabama at Birmingham, Birmingham, Alabama, USA.
Roshini Pasala, 2 Department of Hematology and Oncology, University of Alabama at Birmingham, Birmingham, Alabama, USA.
About the Author: Jeevan Nammi, MBBS, is a postdoctoral research fellow in Endocrinology at the University of Alabama at Birmingham and an MPH candidate in Population Health. His research has received multiple distinctions, including the ENDO Early Career Forum Award, Young Investigator Award, and Outstanding Abstract Awards.
Correspondence: Jeevan Nammi. Address: 1720 University Blvd, Birmingham, AL 35294, USA. Email: jeevannammi1010@gmail.com
Process: Peer-reviewed
Cite as Nammi J., Pasala R. County-Level Food Environment Indices and Diabetes Burden in the United States: An Ecological Cross-Sectional Study. Int J Med Stud. 2026 Apr-Jun;14(2): 73-81.
© 2026 Jeevan Nammi, Roshini Pasala
This work is licensed under a Creative Commons Attribution 4.0 International License
International Journal of Medical Students, VOLUME 14, NUMBER 2, November 2026