Methods: Inclusion-Exclusion Criteria Used for Selection of the Countries.
Shinjit Mani1, Nathan Pramanik1, Deeksha Rao1, Stuti Sharma1, Timur R. Akhmetov2
doi: http://dx.doi.org/10.5195/ijms.2020.693
Volume 8, Number 3: 238-244
Received 17 08 2020: Received 16 10 2020: Rev-request 08 09 2020: Rev-recd 19 09 2020: Rev-recd 18 10 2020: Accepted 05 12 2020
ABSTRACT
Background:Colorectal Cancer (CRC) has multiple risk factors and depends highly on diet. Positive associations of red meat and processed meat intake and CRC have been proven, but no research has been conducted on the relation of spice intake and CRC risk. Various in-vitro studies have demonstrated the anticancer activity of chemicals present in spices, which is the main driving force for our statistical analysis.
Methods:We analyzed Global Burden of Disease (GBD) database, Food and Agricultural Organization of United Nations (FAO) database, and Global Dietary Database (GDD) using Pearson correlation statistics to find any significant correlation, mainly between spice intake and CRC risk. Data from 1990 to 2013 of 100 countries was collected for the analysis. Twenty-three-year average values (±SD) were calculated for CRC risk, spice, red meat, processed meat, vegetable, and fruit intake. CRC risk is taken as dependent variable whereas all other were independent variables. All variables were analyzed using Pearson correlation analysis. Results with p<0.05 were further analyzed using regression analysis.
Results:Pearson correlation showed that spice intake had a significant negative correlation (r= −0.301, p=0.002) whereas red meat (r= 0.722, p<0.001) and processed meat (r= 0.339, p<0.001) had a significant positive correlation with CRC risk.
Conclusion:Significant negative correlation between spice intake and CRC risk indicates that higher spice intake can be preventive against cancer and possibly decrease the risk of colorectal cancer in populations with higher CRC risk.
Keywords: Spices; Colorectal Cancer; Red Meat (Source: MeSH-NLM).
Colorectal Cancer (CRC) is the second most prevalent cancer in the world both in males and females according to the Global Burden of Disease database.1 The highest prevalence is seen among countries in Europe, North America, and West Pacific region.1 Such global distribution is related to the fact that CRC risk is highly dependent on dietary factors. Red meat is defined as “Meat from mammals”, and processed meat is defined as “Meat preserved by smoking, curing or salting, or adding of chemical preservatives”.2 The positive relation between red meat and processed meat intake and CRC has already been proven.3 Polycyclic aromatic hydrocarbons, heterocyclic aromatic amines, and N-nitroso compounds are carcinogens found to be present in red meat and processed meat are responsible for the malignant transformation of glandular epithelial cells, which line the colon and rectum.4 Some studies suggested positive impact of vegetable and fruit intake to deter the risk of CRC.5 But the studies that were done so far to explore the relation of spice intake with CRC have shown conflicting results.6-24
Spices are defined as “Aromatic vegetable substances, used to give special flavor to food”.6 Some studies have shown high spicy food intake is related to an increased CRC risk,7-10 whereas other in-vitro studies explored the possibility of finding novel active biochemical substances with cancer preventive actions in spices.11-24 It was found that polyphenols are abundant in spices.11 Polyphenols are known to prevent carcinogenesis by inhibiting cytochrome P450, which prevents DNA damage by various mechanisms such as direct radical scavenging and modulation of phase II metabolizing enzymes, and can also induce mechanism of apoptosis in the event of DNA damage.11,12 Gingerol (Ginger) and Thumoquinone (Black cumin/Nigella Sativa) are other types of polyphenols that have chemoprotective actions, which are currently being explored by researchers. Thymoquinone is known to upregulate the miR-34a and downregulate Rac1 expression, decreases NF-kB and IKKα/β phosphorylation, and can decrease the activity of ERK1/2 and PI3K.13 Gingerol, on the other hand, shows anti proliferative, cytotoxic, and antitumor activity by regulating various cellular mechanisms, such as Bax/Bcl2, TNF-α, Nrf2, p65/NF-κB, SAPK/JNK, caspases-3, caspase-9, and p53.14,15 Turmeric is a spice extensively used in curries, which contains at least 25 active chemical substances, such as Curcumine and Turmerone, that have antioxidant, neuroprotective, cytotoxic, anti-inflammatory, antiangiogenic, antitumor activities.16,17 Among all these, Curcumine is one of the most effective bioactive substance studied extensively so far. Curcumin can induce apoptosis in response to cell damage by various mechanisms such as downregulating COX-2, NF-kB, PI3K-AKT, and by upregulating DR5, Fas ligand, P53, P38.18-20 It also inhibits metastasis by microRNA expression regulation, and an autophagy modulator by itself.21,22 Other than that, coriander and cinnamon were also found to have anticancer activities.23,24 Among the spices, Capsaicin is an exception, which is known to be tumerogenic. Capsaicin is widely found in paprika, pimento, chili, jalapenos. The carcinogenic properties are mediated through EGFR and TRPV1 pathway, to increase COX2 and induce inflammation.25 Arguably, a low to moderate dose of capsaicin showed anticancer activity is some preclinical studies,25,26 thus the results are conflicting.
In real world data, South Asian countries with high spice intake were seen to have lesser rates of CRC.1 For this to be true, spice intake should have some protective effect against CRC. However, no research has been conducted on the relation of spice intake and CRC on a global scale. The contrast between research data and real-world data, and the results of previous in-vitro studies were the driving force behind this statistical analysis. Thus, we collected data from three global health databases on CRC incidence per 100,000 and five possible dietary factors, which may be responsible to modify the risk of CRC, and analyzed them to gain a global perspective of the CRC risk and its relation to diet. The aim of the analysis was to determine if there was a significant correlation between the selected dietary factors and CRC risk.
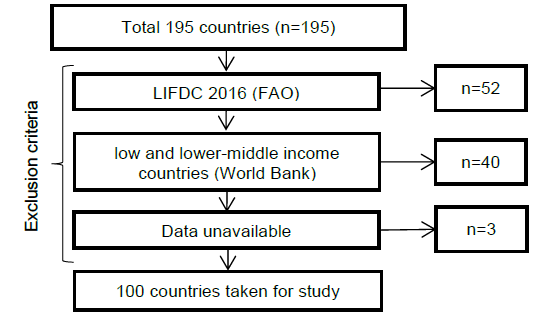
In total, three databases were considered for this analysis, the Global Burden of Disease (GBD) database for data on CRC,1 Food and Agricultural Organization of United Nations (FAO) database,27 and Global dietary database (GDD).28 Out of 195 countries, data from 100 countries was used. We excluded the countries listed in Low Income Food Deficit Countries (LIFDC) by Food and Agricultural Organization of United Nations (n=52),29 and also the low and lower-middle income countries as per World Bank Criteria (n=40).30 Further, the countries with incomplete data were excluded (n=3). This resulted in 100 countries for statistical analysis, as shown in Figure 1A. This analysis considers populations of all ages and both males and females. A total of 95 countries (mainly LIFDC, low and lower-middle income countries) were excluded from the analysis because they had extremely low intake of the dietary factors that were selected for analysis. Including such countries with very low intake of all dietary components carries the risk of a bias in the results. Thus, the above-mentioned criteria were used to exclude LIFDC and low and lower middle-income countries (Figure 1A).
Figure 1AMethods: Inclusion-Exclusion Criteria Used for Selection of the Countries.

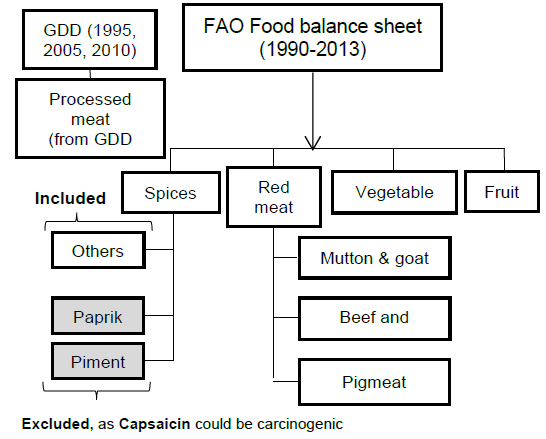
Methods: Sets of the Data Related to Food Intake Collected from Different Global Databases.
Methods: Conversion of the Collected Data Into Average.
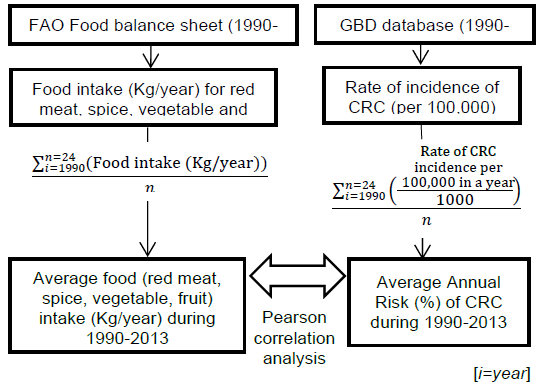
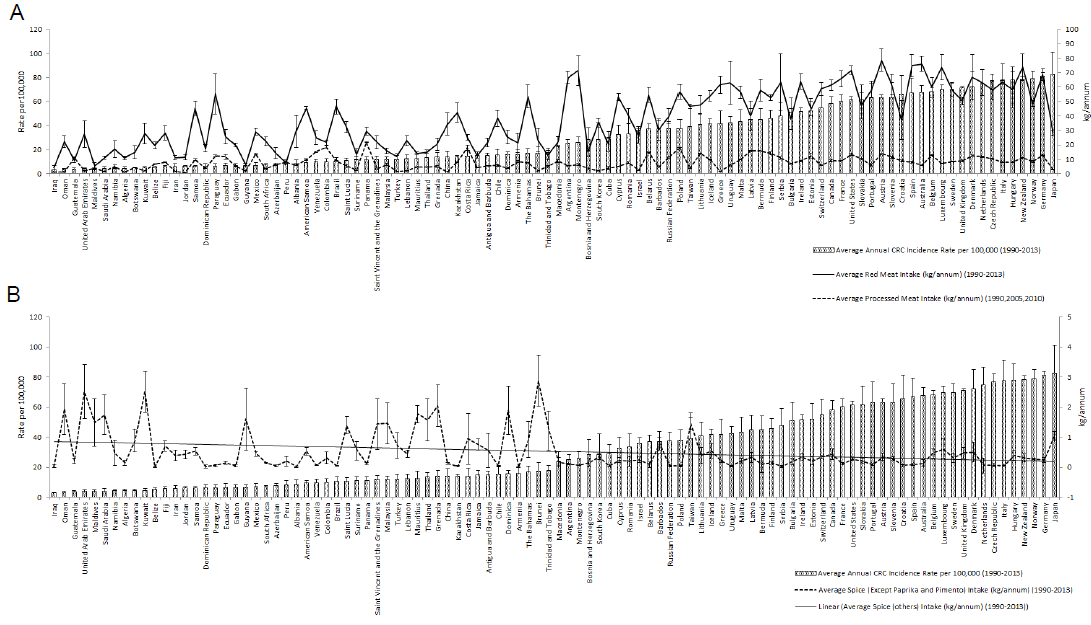
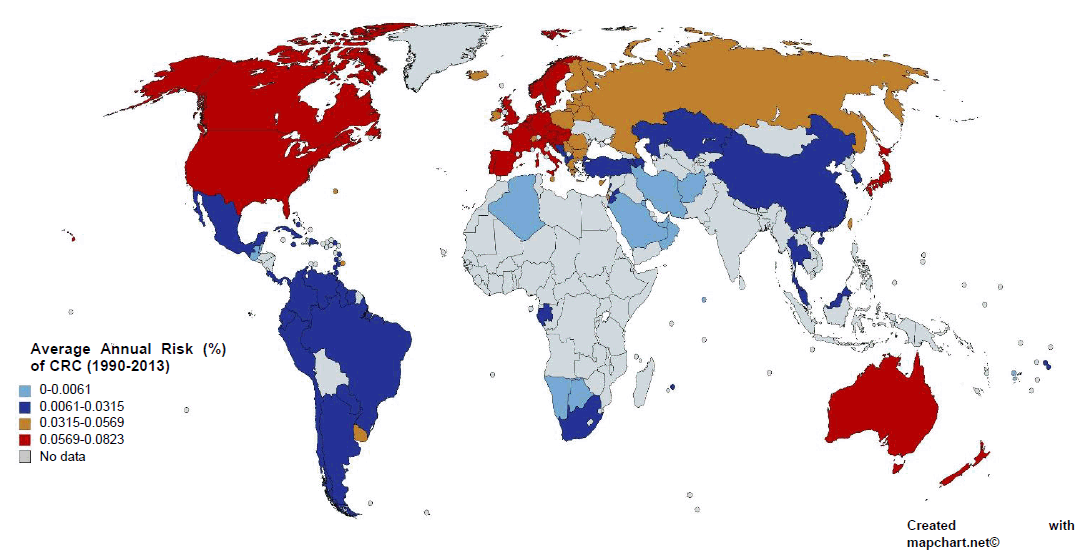
We included data from 1990 to 2013 for CRC incidence and all dietary factors except for the processed meat intake, for which data was only available for the years 1990, 2005, and 2010 from GDD. The five dietary factors which included were spice, red meat, processed meat, vegetable and fruit intake (Figure 1B). These dietary factors were chosen based on previous research.31 Data for all dietary factors (except processed meat) was collected from the food balance sheet of FAO database. The unit for food intake was “kilogram per annum” as shown in Figure 1C. Data on three categories of spices were available on FAO database i.e. ‘Paprika', ‘Pimento', ‘Others'. Out of these 3 categories we took only the data from the category ‘others'. Data for ‘Paprika' and ‘Pimento' was rejected as their carcinogenicity was proven previously with some conflicting results.25 For red meat intake, we included data from categories ‘Mutton & goat', ‘Beef and buffalo', and ‘Pigmeat'. For data of vegetable and fruit intake, we used the category ‘Vegetables' and ‘Fruits' from FAO food balance sheet. As an exception, data for processed meat was taken from the Global Dietary database, with the average data from the three years, 1990, 2005, and 2010, being used in the final calculation. All this data, except for processed meat intake, was further converted to average annual food intake using the formula as shown in Figure 1C. “Average red meat/processed meat/spice/vegetable/fruit intake” corresponds to the mean value of 24 years of data. The data on CRC was collected from the Global Burden of Disease database by the unit “Rate of incidence per 100,000” and converted to “Average annual risk (%) of CRC” using the formula as shown in Figure 1C. Graphical representation of the partial dataset is shown in Figure 2. Primary scale was used to show the “CRC incidence per 100,000” using a bar graph with corresponding standard deviation (SD) and the secondary scale is used to show the food intake “kg/annum” using line chart with corresponding SDs. The complete dataset can be downloaded here it contains data on Average Annual Rate of CRC Incidence per 100,000 of all 100 countries, arranged in ascending order, along with the data of all other dietary factors with SD, and 95% confidence interval (CI). This data was used for final statistical analysis. In an exception to the country “Bermuda”, the data on processed meat intake was supplemented by the data of “Latin America, Central Region” from GDD in place of original data, as the original data was missing when the database was accessed. The data of Average annual risk (%) of CRC is shown in Figure 3, as a map, where Z score of −2 to +2 was used to identify the countries according to their CRC risk. To create the map, we used the website mapchart.net, and the template of the map with microstates. Four different color codes were used to identify the risks according to their Z-scores.
Figure 2Data Visualisation According to The Ascending Order of Colorectal Cancer (CRC) Incidence and Food Intake Pattern. A. Red Meat and Processed Meat Intake (kg/annum) Plot Shows Increasing Trend of Intake Along with Increasing Cancer Risk. B. Graph Shows a Decreasing Trend of Spice Intake (Kg/annum) with Increasing CRC Incidence
Average Annual Risk (%) of Colorectal Cancer (CRC) of the Selected Countries, 1990-2013.
We used IBM SPSS statistics v23 for all statistical analysis. Histograms with normal distribution curves were used to visualize the data distribution of all dietary factors. Boxplots were used to compare the data distribution among the variables. Average annual risk (%) of CRC was the dependent variable and the rest were taken as independent variables. All the variables were analysed using Pearson correlation analysis. A 95% CI of the Pearson correlation coefficient was calculated according to the formula of Fisher's transformation.32 Scatter-dot plot was used to visualise the correlation statistics, using trend line and 95%CI of the correlation. The correlation results with p<0.05 were then analysed using forward and backward regression analysis for further confirmation. The data was also analysed using partial correlation analysis to determine any possible dependency between independent variables.
Overall, the result shows the dynamics of CRC risk and food intake along with their correlation. Figure 2A describes the data on red meat and processed meat on the background of CRC incidence rate per 100,000. There was higher red meat consumption among the countries with higher CRC incidences, such as Germany (81.24 per 100000; 60.53 kg/annum), New Zealand (78.36 per 100000; 73.73 kg/annum), Denmark (72.38 per 100000; 66.88 kg/annum) with exceptions such as Croatia (65.91 per 100000; 37.16 kg/annum), and Bulgaria (51.16 per 100000; 37.86 kg/annum). Some of the countries with low CRC incidence were found to have higher red meat intake, which is similar to the countries with high CRC risk, i.e. Paraguay (6.54 per 100000; 55.21 kg/annum), Samoa (6.46 per 100000; 44.57 kg/annum), Brazil (10.76 per 100000; 46.54 kg/annum). The reverse is also observed in the case of Japan, where the red meat and processed meat intake is relatively less (28.18 kg/annum; 2.83 kg/annum) with the highest CRC incidences (82.71 per 100000) among all the 100 countries. A positive was also observed between processed meat intake and CRC incidences. However, some countries such as Panama (11.46 per 100000; 21.79 kg/annum), Colombia (9.94 per 100000; 18.55 kg/annum), and Costa Rica (14.4 per 100000; 17.93 kg/annum) had higher processed meat intake but decreased CRC risk. Overall, the trend for both red meat and processed meat consumption is positive with increasing CRC incidence. The data plot in Figure 2B shows most of the countries with higher CRC incidences consume low spice i.e. Germany (81.24 per 100000; 0.24 kg/annum), Italy (77.70 per 100000; 0.056 kg/annum), Czech Republic (76.8 per 100000; 0.065 kg/annum), and the opposite was seen with the countries with low CRC incidences, with some exceptions, such as Iraq (3.21 per 100000; 0.034 kg/annum), Belize (5.34 per 100000; 0.007 kg/annum), Dominican Republic (6.51 per 100000; 0.029 kg/annum) and Gabon (6.90 per 100000; 0.057 kg/annum). Altogether, there is an inverse relation between spice consumption and CRC incidence. The data plot on vegetable and fruit intake is not shown, as the correlation was not significant.
The data on Average Annual Risk (%) of CRC in Figure 3 clearly identified the countries of South East Asia, Middle East, North Africa and South America in a below average risk (0-0.0315%). The countries of Eastern Europe and Eurasia region have higher than average risk (0.0315-0.0569%). Most importantly, the countries of North America, Europe, and Oceania are identified with highest risk of CRC (0.0569-0.0823%). The color scheme is based on the Z-score of Average Annual Risk (%) of CRC, where blue indicates −2SD range from the mean, navy-blue indicates −1SD range from mean, brown indicates +1SD range from mean, and red indicates +2SD range from mean. The mean risk of CRC (±SD) is 0.0315 (±0.0254).
The descriptive statistics shows the mean, median, mode, standard deviation (SD), excess kurtosis, skewness, range, minimum, maximum, and count of all the variables (Table 1). Careful evaluation of Excess Kurtosis shows that the variables “Average Annual Risk (%) of CRC” (−1.11), “Average Red Meat Intake” (−1.26), and “Average Processed Meat intake” (−0.065) are platykurtic in nature with values less than 0. It is further explained using the histogram of the variable in Figure 4A. The other three variables are leptokurtic, with an excess kurtosis value greater than 0. Among them “Average Spice Intake” and “Average Fruit Intake” has the highest excess kurtosis of 2.73 and 4.99. These same two variables are also observed to have high skewness (positive), with skewness values of 1.8 and 1.5. The data shows that the majority of the countries have a less than average spice (mean 0.527, mode 0.472) and fruit intake (mean 101.29, mode 166.08), while a minority has a very high intake. For further understanding, we plotted a histogram chart of all five dietary factors. As shown in Figure 4 A-E, the histogram shows bimodal distribution for the variable “Average Red Meat Intake”, with the first one nearly at 20kg/annum and the other at 60kg/annum. This bimodal distribution is the reason of the low excess kurtosis value, as the distribution is spread widely on the tails side. Other variables had normal distributions with moderate to high positive skewness, and the mode value less than the mean values. The histogram of “Average Spice Intake” shows a very low mode value (0.472), which actually contributes to the skewness of the dataset. On the other hand, the boxplots (Figure 4F) provide a visual comparison between all five dietary factors. It accurately shows the range, first quartile, median, third quartile, and the outliers. The variables “Processed Meat Intake” (high 21.7, low 0.93) and “Average Spice Intake” (high 2.87, low 0.007) have relatively small range of values, thus for proper understanding, the boxplots are shown again in Figure 4H and Figure 4K. It is important to understand that outliers that are shown in the graphs, are not excluded from the analysis, Despite being outside the range of (Q1-1.5*IQ) to (Q3+1.5*IQ) and are significant.
Table 1.Descriptive Statistics
| Descriptive Statistics | Average Annual CRC Incidence Rate per 100,000 (1990–2013) | Average Red Meat Intake (kg/annum) (1990–2013) | Average Processed Meat Intake (kg/annum) (1990,2005,2010) | Average Spice (Except paprika and pimento) Intake (kg/annum) (1990–2013 | Average Vegetable Intake (kg/annum) (1990–2013) | Average Fruit Intake (kg/annum) (1990–2013) |
|---|---|---|---|---|---|---|
| Mean | 31.567 | 38.214 | 7.625 | 0.528 | 97.906 | 101.298 |
| Median | 20.996 | 36.250 | 7.135 | 0.285 | 89.617 | 95.118 |
| Mode | N/A | 45.571 | 7.994 | 0.473 | 11.713 | 166.083 |
| Standard Deviation | 25.424 | 20.829 | 4.607 | 0.634 | 55.362 | 48.019 |
| Kurtosis | −1.113 | −1.269 | −0.066 | 2.739 | 0.437 | 4.994 |
| Skewness | 0.584 | 0.184 | 0.621 | 1.803 | 0.895 | 1.543 |
| Range | 79.505 | 74.545 | 20.854 | 2.870 | 249.170 | 307.264 |
| Minimum | 3.215 | 4.06 | 0.937 | 0.008 | 11.713 | 28.351 |
| Maximum | 82.720 | 78.605 | 21.791 | 2.878 | 260.882 | 335.615 |
| Count | 100 | 100 | 100 | 100 | 100 | 100 |
Statistical Analysis of Data Sets. A-E. Histogram showing the normal distribution and the skewness of the data. F. Boxplots to compare between different dietary intake factors. G-K. Dot plot distribution, visualization of correlation analysis with 95%CI along with the corresponding boxplots.
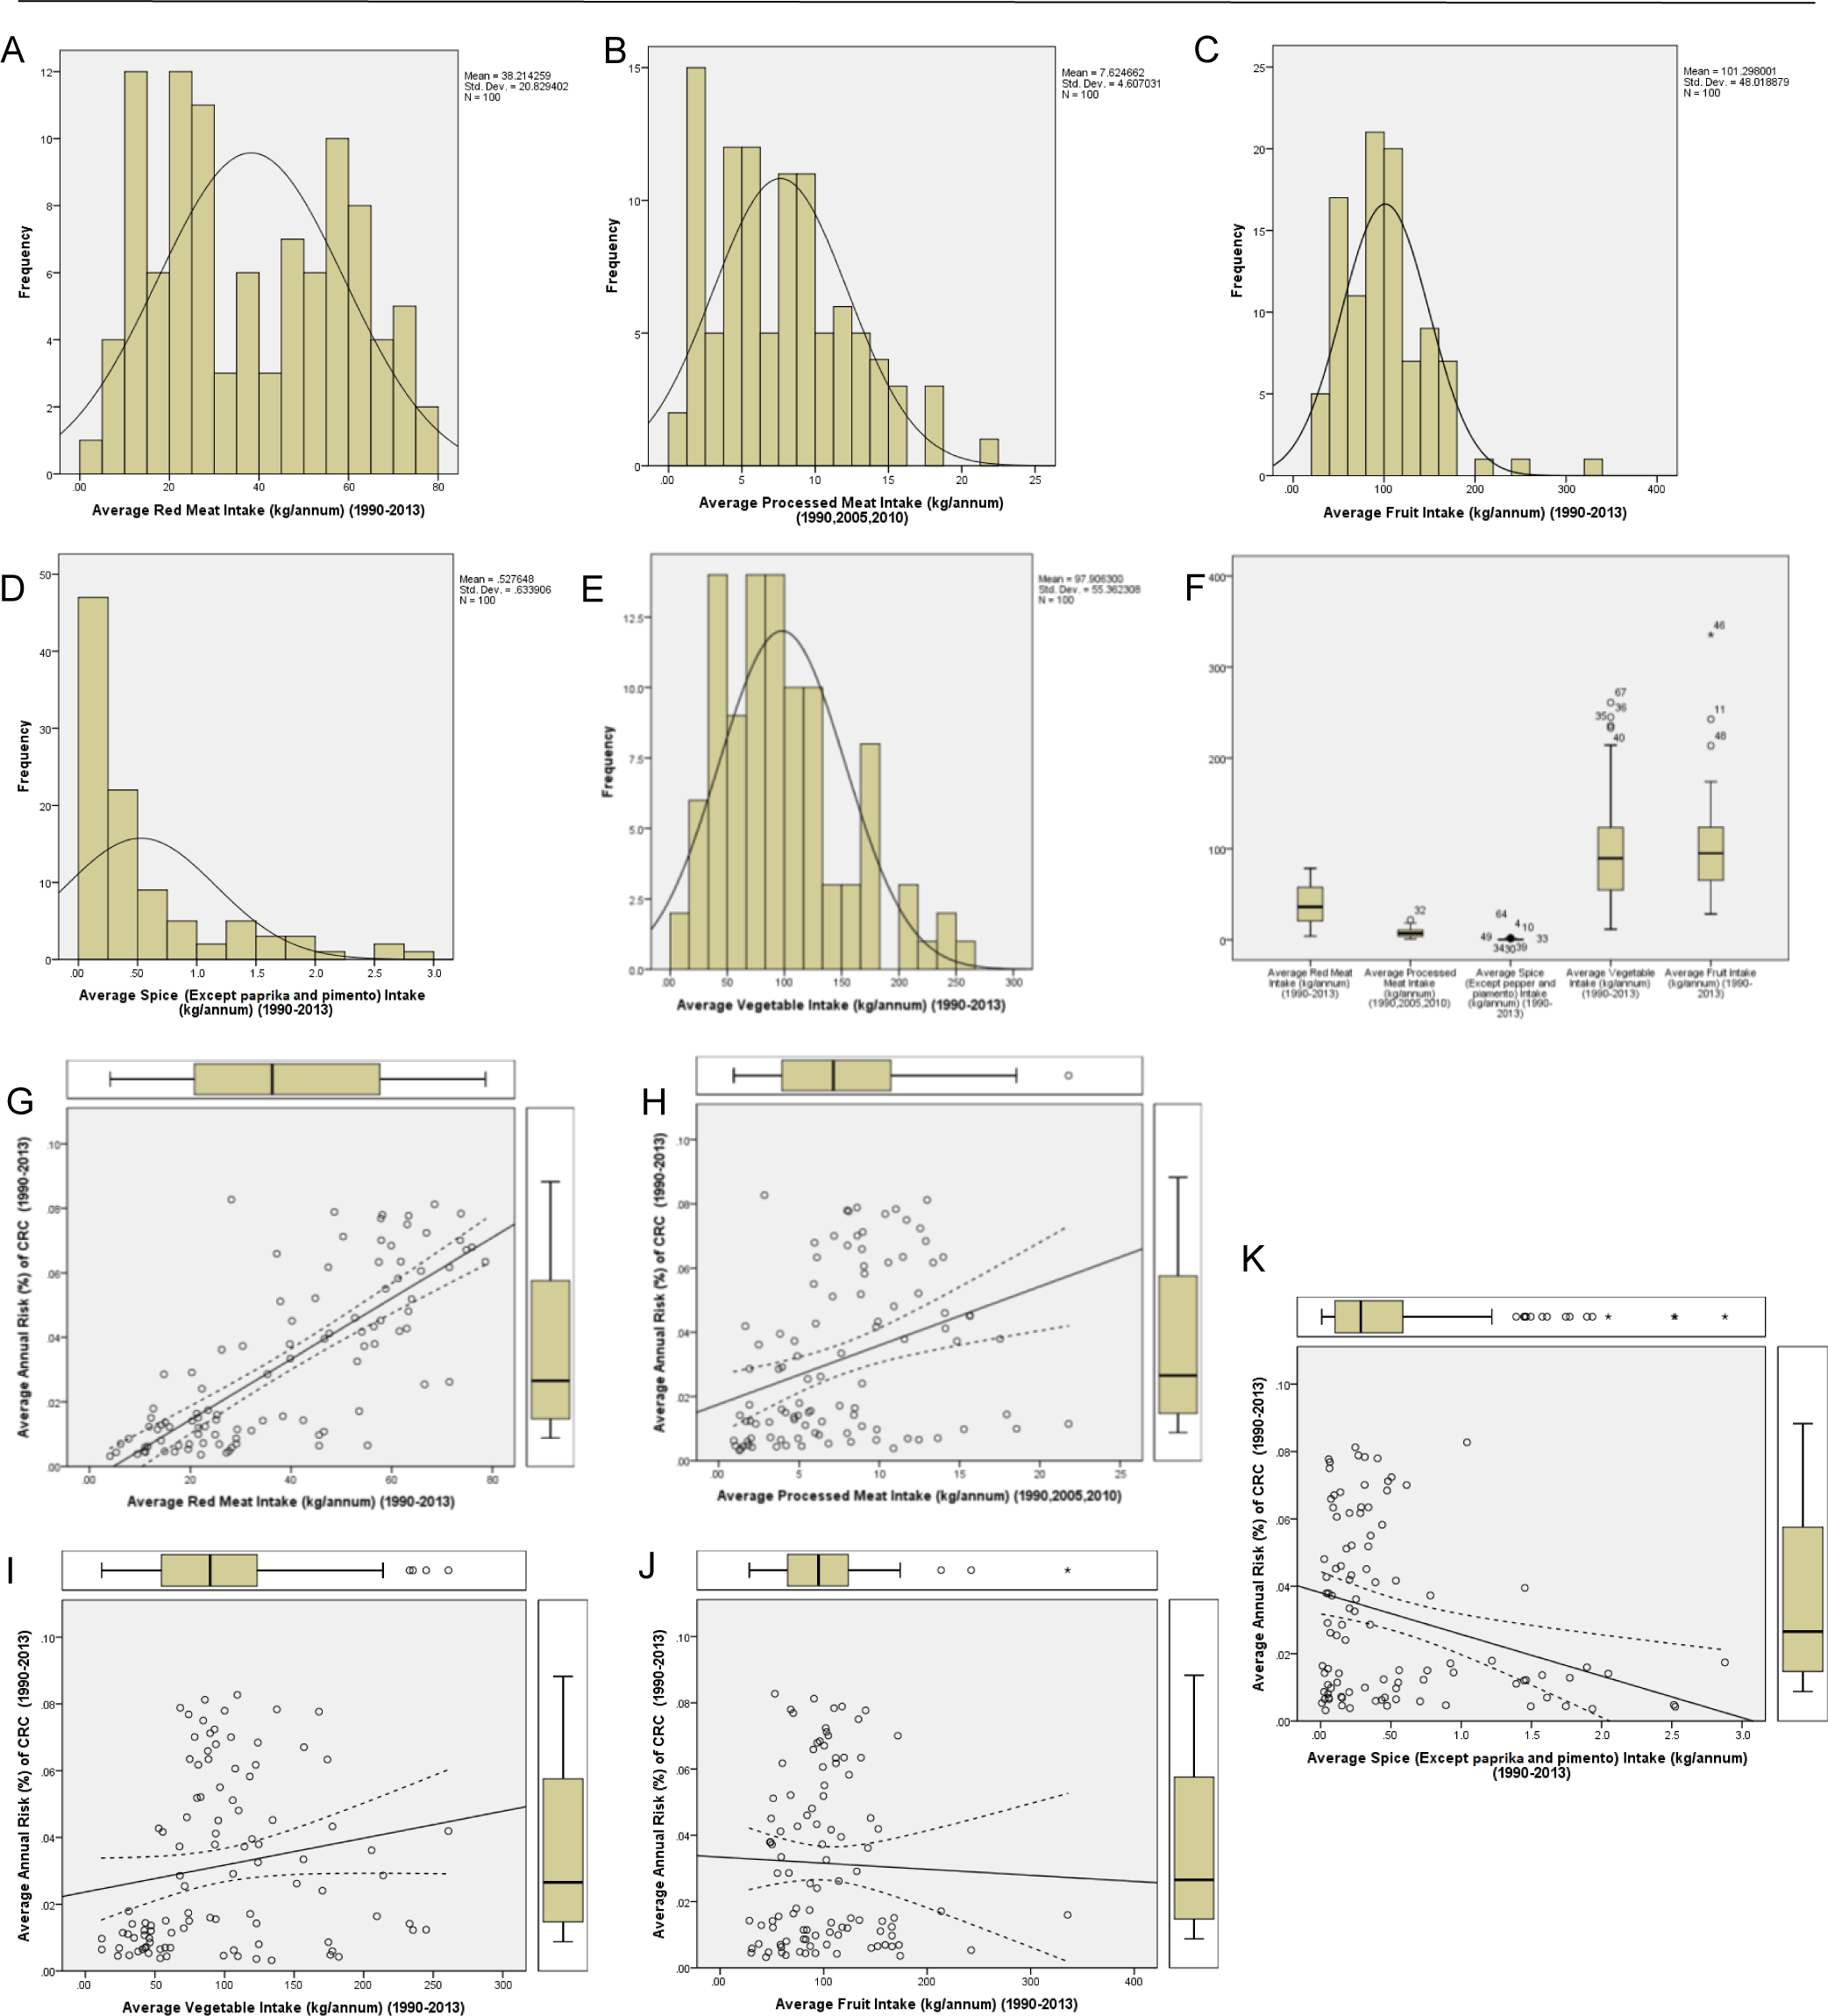
To determine the statistical significance, we used Pearson correlation analysis (Table 2). The results showed a significant positive correlation between CRC risk and red meat (r=+0.772, 2-tailed p<0.001, 95%CI .678 to .841) as well as processed meat (r=+0.332, 2-tailed p=0.001, 95%CI .145 to .496). A significant negative correlation was also found between CRC risk and spice intake (r=−0.301, 2-tailed p=0.002, 95%CI −.470 to −.111). Surprisingly, vegetable (r=0.176, 2-tailed p=0.080, 95%CI −.021 to .360) and fruit intake (r=-.035, 2-tailed p=0.733, 95%CI −.230 to .163) had no significant correlation with CRC. The scatter-dot plot for the visualization of the correlation analysis in Figure 4G–K shows the regression line with 95%CI which corresponds to the data given in the Table 2. Further investigation using linear regression analysis of the data showed the model fit or R2 for red meat was highest (R2=0.596) followed by processed meat (R2=0.111) and spice intake (R2=0.091). In forward and backward regression analysis (data not shown) we found that the predictive power of CRC risk is highest in “Average Red Meat Intake”. The partial correlation (Table 3) was conducted to answer the question of interdependence of the dietary factors. As the results show, “Average Red Meat Intake” had a significant positive partial correlation to CRC (0.727, p<0.001), while “Average Processed Meat Intake” (−0.035, p=0.735) and “Average Spice Intake” (−0.043, p=0.675) had no significant partial correlation.
Table 2.Results of Pearson Correlation Analysis.
| Average Risk (%) of CRC during the year 1990–2013 (n=100) | ||||
|---|---|---|---|---|
| Pearson Correlation Statistics ‘R’ (P value - 2 tailed) | 95% CI of correlation coefficient* | Regression analysis R square | Regression analysis Unstandardized coeff. (constant, B) | |
| Average Spice Intake (kg/annum) (1990–2013) | −0.301 (0.002) | −0.470 to −0.111 | 0.091 | (0.038, −0.012) |
| Average Red Meat Intake (kg/annum) (1990–2013) | 0.772 (<0.001) | 0.678 to 0.841 | 0.596 | (−0.004, 0.001) |
| Average Processed Meat Intake (kg/annum) (1990, 2005, 2010) | 0.332 (0.001) | 0.145 to 0.496 | 0.111 | (0.018, 1 0.002) |
| Average Vegetable Intake (kg/annum) (1990–2013) | 0.176 (0.080) | −0.021 to 0.360 | - | - |
| Average Fruit Intake (kg/annum) (1990–2013) | −0.035 (0.733) | −0.23 to 0.163 | - | - |
Results of Partial Correlation Analysis.
| Average Risk (%) of CRC during the year 1990–2013 (n=100) | ||
|---|---|---|
| Partial Correlation | P value | |
| Average Red Meat Intake (kg/annum) (1990–2013) | 0.727 | <0.001 |
| (Controlling for spice and processed meat) | −0.035 | 0.735 |
| Average Processed Meat Intake (kg/annum) (1990, 2005, 2010) | −0.043 | 0.675 |
It is worth mentioning that the negative correlation between spice intake and CRC is a novel finding. The positive correlation of red meat and processed meat with CRC is in agreement with previous studies.4 Different research has shown conflicting results regarding vegetable consumption and fruit consumption and their effect on CRC, where some showed a negative relation, others denied any relation at all.31,33,34 In our research, we did not find any significant correlation. Data on spice intake shows high positive skewness with mode value much less than mean value, this confirms that the majority of the countries have less than average spice intake. Model fit (R2) plays a major role in the forward and backward regression, which explains the decreased predictive power by “Average Processed Meat Intake” and “Average Spice Intake”. As per the data on partial correlation, red meat intake is found to be the major cause of CRC irrespective of the processed meat and spice intake, while processed meat intake has no significant influence on CRC by itself. And most importantly, spice intake does not influence CRC risk alone, the significant negative correlation is seen when red meat intake is considered. In conclusion, our results indicate that spice intake can have a beneficial effect among the population with high red meat intake, which may decrease the risk of CRC in the long term, but vegetable and fruit intake may not have any additional benefit to deter CRC risk. This new finding in this analysis agrees with the preclinical studies that demonstrated the anticancer properties of various spices.5-19
It is important to mention the limitations of this analysis. In the FAO database, there was no mention of any particular spices in the category ‘others', which compromises the accuracy of the results to some extent. The other two categories ‘Paprika' and ‘Pimento' were not taken into the analysis. Previous studies suggested that high amounts of spicy food that are rich in chilies may cause chronic inflammation in gastrointestinal tract and in long term can trigger cancer, with some conflicting results claiming capsaicin in low doses can have anti-cancer activities.25,26 Due to these conflicting results we did not consider
‘Paprika' and ‘Pimento' for the analysis. Recent data for every country as not available. Data of food intake later than the year 2013 was not available in FAO database, thus we took the data from 1990 to 2013 for our analysis. The GDD had the data only for the year 1995, 2005, 2010. These three years of data was used in calculation of processed meat intake, which may have limited the accuracy of the analysis. With more accurate data and a larger sample size the model fit of the data can be improved and enhance accuracy.
The risk of cancer can vary from population to population, depending on multiple factors from behavioral to biological. For instance, this is seen in Japan where despite high spice intake and low red meat intake, there is higher CRC risk, possibly due to their genetic predisposition for gastrointestinal cancer. This contrasts with Europe and North America, where high CRC risk is largely due to unhealthy dietary pattern containing high red meat.35
Thus, studies conducted within a particular population may not provide an exact picture of a disease or treatment. Therefore, an analysis using global databases is important. In recent years, global health has become an important topic of discussion. It is important to view disease as a global issue which needs a large-scale solution. It is not enough to improve individual health to create a sustainable future with a healthy population. To do so requires addressing the social, behavioral and dietary changes which can be implemented on a large scale within the population. The novel finding in this analysis is the negative correlation of spice intake and CRC risk. The most important question that arises from this data is: what is the adequate amount of spice intake that can help decrease the CRC risk? To answer this question, further research needs to be conducted, using different population groups with variable risks. Our results show that a simple addition of spice in the diet may be beneficial to the population where red meat intake is high, and provides an incentive to further explore the cancer preventive mechanism of the spices, and their use in the field of global health and cancer prevention.
We want to thank Prof. S.V. Petrov, Professor at Department of General Pathology, Kazan State Medical University, for supporting and supervising the research project
The Authors have no funding, financial relationships or conflicts of interest to disclose.
Conceptualization: SM, TRA. Data Curation, Investigation: SM, NP, DR. Formal Analysis, Resources, Validation: SM, NP, DR, SS, TRA. Methodology: SM. Project Administration, Visualization: SM, NP. Software: SM, NP, DR, SS. Supervision: SM, TA. Writing – Original Draft Preparation: SM, NP, DR. Writing – Review & Editing: SM, NP, DR, SS, TRA
1. Global Burden of Disease Collaborative Network. Global Burden of Disease Study 2017 (GBD 2017) Results. Seattle, United States: Institute for Health Metrics and Evaluation (IHME), 2018. Available from http://ghdx.healthdata.org/gbd-results-tool; Last updated Aug 01, 2020; cited Aug 01, 2020.
2. IARC Working Group on the Evaluation of Carcinogenic Risks to Humans. Red Meat and Processed Meat. Lyon (FR): International Agency for Research on Cancer; 2018. (IARC Monographs on the Evaluation of Carcinogenic Risks to Humans, No. 114.) Available from: https://www.ncbi.nlm.nih.gov/books/NBK507971/; Last updated Mar, 2018; cited Sep 17, 2020.
3. Aykan NF. Red Meat and Colorectal Cancer. Oncol Rev. 2015 Dec 28;9(1):288.
4. Demeyer D, Mertens B, De Smet S, Ulens M. Mechanisms Linking Colorectal Cancer to the Consumption of (Processed) Red Meat: A Review. Crit Rev Food Sci Nutr. 2016 Dec 9;56(16):2747-66.
5. Hidaka A, Harrison TA, Cao Y, Sakoda LC, Barfield R, Giannakis M, et al. Intake of dietary fruit, vegetables, and fiber and risk of colorectal cancer according to molecular subtypes: A pooled analysis of 9 studies. Cancer Res. 2020 Aug 14;canres.0168.2020.
6. Cambridge University Press. Cambridge dictionary, Spice. Available from: https://dictionary.cambridge.org/dictionary/english/spice; Last updated Sep, 2020; cited Sep 17, 2020.
7. Chen YH, Zou XN, Zheng TZ, Zhou Q, Qiu H, Chen YL, et al. High Spicy Food Intake and Risk of Cancer: A Meta-analysis of Case-control Studies. Chin Med J (Engl). 2017 Sep 20;130(18):2241-2250.
8. Mathew A, Gangadharan P, Varghese C, Nair MK. Diet and stomach cancer: a case-control study in South India. Eur J Cancer Prev. 2000 Apr;9(2):89-97.
9. López-Carrillo L, Hernández Avila M, Dubrow R. Chili pepper consumption and gastric cancer in Mexico: a case-control study. Am J Epidemiol. 1994 Feb 1;139(3):263-71.
10. Pabalan N, Jarjanazi H, Ozcelik H. The impact of capsaicin intake on risk of developing gastric cancers: a meta-analysis. J Gastrointest Cancer. 2014 Sep;45(3):334-41.
11. Arora I, Sharma M, Tollefsbol TO. Combinatorial Epigenetics Impact of Polyphenols and Phytochemicals in Cancer Prevention and Therapy. Int J Mol Sci. 2019 Sep 14;20(18):4567.
12. Majidinia M, Bishayee A, Yousefi B. Polyphenols: Major regulators of key components of DNA damage response in cancer. DNA Repair (Amst). 2019 Oct;82:102679.
13. Imran M, Rauf A, Khan IA, Shahbaz M, Qaisrani TB, Fatmawati S, et al. Thymoquinone: A novel strategy to combat cancer: A review. Biomed Pharmacother. 2018 Oct;106:390-402.
14. de Lima RMT, Dos Reis AC, de Menezes APM, Santos JVO, Filho JWGO, Ferreira JRO, et al. Protective and therapeutic potential of ginger (Zingiber officinale) extract and [6]-gingerol in cancer: A comprehensive review. Phytother Res. 2018 Oct;32(10):1885-1907.
15. Mahomoodally MF, Aumeeruddy MZ, Rengasamy KRR, Roshan S, Hammad S, Pandohee J. Ginger and its active compounds in cancer therapy: From folk uses to nano-therapeutic applications. Semin Cancer Biol. 2019 Aug 11:S1044-579X(19)30213-5.
16. Dosoky NS, Setzer WN. Chemical Composition and Biological Activities of Essential Oils of Curcuma Species. Nutrients. 2018 Sep 1;10(9):1196.
17. Ghandadi M, Sahebkar A. Curcumin: An Effective Inhibitor of Interleukin-6. Curr Pharm Des. 2017;23(6):921-931.
18. Ismail NI, Othman I, Abas F, H Lajis N, Naidu R. Mechanism of Apoptosis Induced by Curcumin in Colorectal Cancer. Int J Mol Sci. 2019 May 17;20(10):2454.
19. Kunnumakkara AB, Bordoloi D, Harsha C, Banik K, Gupta SC, Aggarwal BB. Curcumin mediates anticancer effects by modulating multiple cell signaling pathways. Clin Sci (Lond). 2017 Jul 5;131(15):1781-1799.
20. Deng YI, Verron E, Rohanizadeh R. Molecular Mechanisms of Anti-metastatic Activity of Curcumin. Anticancer Res. 2016 Nov;36(11):5639-5647.
21. Zhou S, Zhang S, Shen H, Chen W, Xu H, Chen X, et al. Curcumin inhibits cancer progression through regulating expression of microRNAs. Tumour Biol. 2017 Feb;39(2):1010428317691680.
22. Shakeri A, Cicero AFG, Panahi Y, Mohajeri M, Sahebkar A. Curcumin: A naturally occurring autophagy modulator. J Cell Physiol. 2019 May;234(5):5643-5654.
23. Prachayasittikul V, Prachayasittikul S, Ruchirawat S, Prachayasittikul V. Coriander (Coriandrum sativum): A promising functional food toward the well-being. Food Res Int. 2018 Mar;105:305-323.
24. Dutta A, Chakraborty A. Cinnamon in Anticancer Armamentarium: A Molecular Approach. J Toxicol. 2018 Mar 29;2018:8978731.
25. Georgescu SR, Sârbu MI, Matei C, Ilie MA, Caruntu C, Constantin C, et al. Capsaicin: Friend or Foe in Skin Cancer and Other Related Malignancies? Nutrients. 2017 Dec 16;9(12):1365.
26. Ann M. Bode and Zigang Dong. The Two Faces of Capsaicin. Cancer Res. 2011 April 15; 71(8):2809-2814.
27. Food and Agricultural Organization of United Nations. FAOSTAT. Food balance sheet. Available from: http://www.fao.org/faostat/en/#data/FBS; Last updated December, 2019; cited Aug 01, 2020.
28. Global Dietary Database Consortium, Nutrition and Chronic Disease Expert Group (NutriCoDE). Global Dietary Database 1980-2011. [Unpublished]. Available from: https://www.globaldietarydatabase.org/our-data; Last updated Jul 30, 2020; cited Aug 01, 2020.
29. Food and Agricultural Organization of United Nations. LIFDCs 2016. Available from: http://www.fao.org/countryprofiles/lifdc/en/; Last updated Dec 13, 2019; cited Aug 01, 2020.
30. The World Bank. World Bank Country and Lending Groups. Available from: https://datahelpdesk.worldbank.org/knowledgebase/articles/906519-world-bank-country-and-lending-groups; Last updated Jul 01, 2020; cited Aug 01, 2020.
31. Schwingshackl L, Schwedhelm C, Hoffmann G, Knüppel S, Laure Preterre A, Iqbal K, et al. Food groups and risk of colorectal cancer. Int J Cancer. 2018 May 1;142(9):1748-1758.
32. Bewick V, Cheek L, Ball J. Statistics review 7: Correlation and regression. Crit Care. 2003 Dec;7(6):451-9.
33. Vieira AR, Abar L, Chan DSM, Vingeliene S, Polemiti E, Stevens C, et al. Foods and beverages and colorectal cancer risk: a systematic review and meta-analysis of cohort studies, an update of the evidence of the WCRF-AICR Continuous Update Project. Ann Oncol. 2017 Aug 1;28(8):1788-1802.
34. Millen AE, Subar AF, Graubard BI, Peters U, Hayes RB, Weissfeld JL, et al.. Fruit and vegetable intake and prevalence of colorectal adenoma in a cancer screening trial. Am J Clin Nutr. 2007 Dec;86(6):1754-64.
35. Keum N, Giovannucci E. Global burden of colorectal cancer: emerging trends, risk factors and prevention strategies. Nat Rev Gastroenterol Hepatol. 2019 Dec;16(12):713-732.
Shinjit Mani, 1 Medical Student. Department of General Medicine, Faculty of Foreign Students, Kazan State Medical University, Kazan, Russian Federation
Nathan Pramanik, 1 Medical Student. Department of General Medicine, Faculty of Foreign Students, Kazan State Medical University, Kazan, Russian Federation
Deeksha Rao, 1 Medical Student. Department of General Medicine, Faculty of Foreign Students, Kazan State Medical University, Kazan, Russian Federation
Stuti Sharma, 1 Medical Student. Department of General Medicine, Faculty of Foreign Students, Kazan State Medical University, Kazan, Russian Federation
Timur R. Akhmetov, 2 MD. PhD. Associate Professor, Department of General Pathology, Kazan State Medical University, Kazan, Russian Federation
About the Author: Shinjit Mani is currently a fifth-year medical student at Kazan State Medical University, Kazan, Russia of a total six-year program. He completed this particular research work under the supervision of Asso. Prof. T.R. Akhmetov, at the Department of Pathology of Kazan State Medical University in 2019. Currently he is working in a preclinical laboratory-based cancer research program under the supervision of Prof. Sergei Boichuk. He was chosen for the “Board of Honor 2019” by the university for his success in studies and research work.
Correspondence: Shinjit Mani. Address: Ulitsa Butlerova 49, Kazan, Russian Federation. Email: shinjit.mani@gmail.com
Editor: Francisco J. Bonilla-Escobar Student Editors: Colleen Campbell, Brandon Belbeck, Nicole Katherine Conners, Thanthima Suwanthawornkul, Shawn Albers Copyeditor: Adnan Mujanovic Proofreader: Sohaib Haseeb
Cite as: Mani S, Pramanik N, Rao D, Sharma S, Akhmetov TR. The Negative Correlation of Spice Intake and Colorectal Cancer: A Statistical Analysis of Global Health Databases. Int J Med Students. 2020 Sep-Dec;8(3):238-44.
Copyright © 2020 Shinjit Mani, Nathan Pramanik, Deeksha Rao, Stuti Sharma, Timur R. Akhmetov
This work is licensed under a Creative Commons Attribution 4.0 International License.
International Journal of Medical Students, VOLUME 8, NUMBER 3, December 2020