
Blindness Disparities Between Racial/Ethnic Groups in the State of Texas
DOI:
https://doi.org/10.5195/ijms.2024.2044Keywords:
Ethnicity, Quality of life , Prevalence, Cultural Diversity, Texas, Centers for Disease Control and Prevention, Outcome Assessment, Health Care, Blindness, Health Disparities , Disparities, Racial/Ethnic Groups, Health Outcomes, Crude Prevalence, Hispanic, Age Groups , Socioeconomic Status, Vision Health , Retrospective Study, Statistical SignificanceAbstract
Background: There are disparities in health outcomes between races. Blindness is associated with decreased quality of life and negative health outcomes. There is little published data investigating the difference in the prevalence of blindness between races/ethnicities nationally and in Texas.
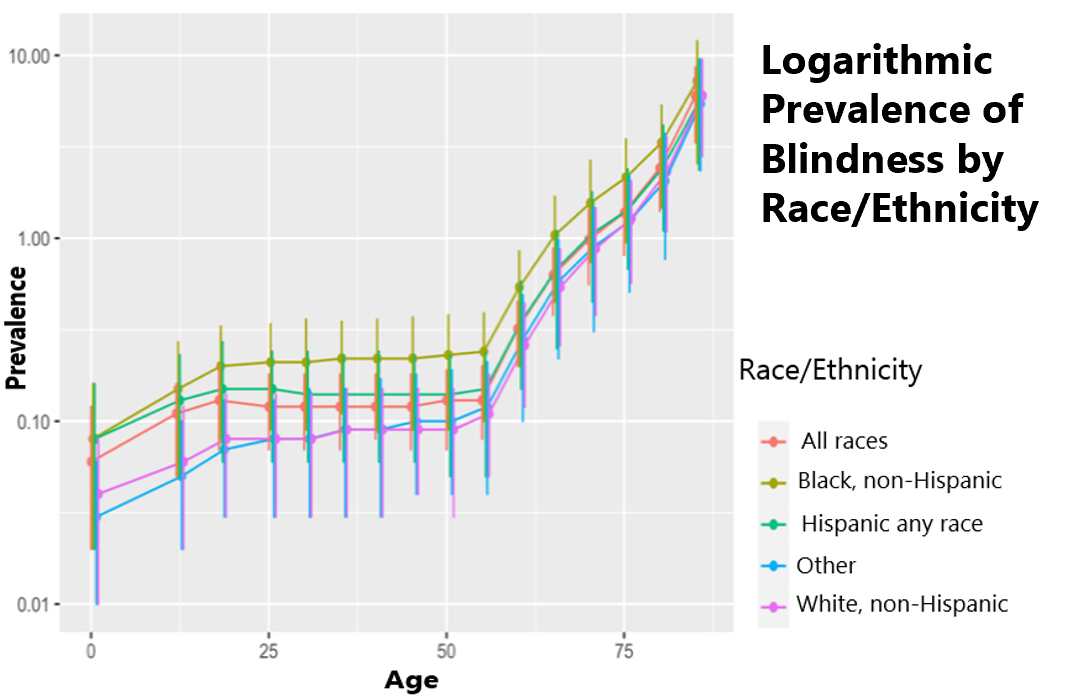
Methods: This retrospective observational study investigates the differences in crude prevalence of blindness between different race/ethnicities in Texas. Data was gathered from the Centers for Disease Control and Prevention (CDC) website Vision and Eye Health Surveillance System (VEHSS) using the most recently available Compositive Estimate data from the state of Texas. The variables compared were age groups and race/ethnicity categories of Black, non-Hispanic, Hispanic, any race and White, non-Hispanic, referred to as “Black,” “Hispanic,” and “White” respectively. The logs of the relative ratios and Z scores were used to compare each age group.
Results: The Black group consistently had the highest crude prevalence of blindness across age groups; The White group had the lowest prevalence. The Hispanic group consistently had prevalence rates that were between the Black and White groups. No differences were found to be statistically significant.
Conclusion: This data shows that, despite ongoing diversity and inclusion efforts, ongoing inequalities exist in healthcare outcomes. In the state of Texas, this is made apparent by the difference in blindness prevalence between Black, Hispanic, and White populations. These data can be used to bring about change that needs to be addressed at the state and institutional level.
References
Berisha E, Dubey RS, Olson E. Monetary policy and the racial wage gap. Empir Econ. 2022;63:3045-9. DOI: https://doi.org/10.1007/s00181-022-02233-5
Hoang T, Suh J, Sabharwal M. Beyond a Numbers Game? Impact of Diversity and Inclusion on the Perception of Organizational Justice. Public Administration Review. 2022;82(3):537–55. DOI: https://doi.org/10.1111/puar.13463
Nguemeni Tiako MJ, Ray V, South EC. Medical Schools as Racialized Organizations: How Race-Neutral Structures Sustain Racial Inequality in Medical Education—a Narrative Review. J Gen Intern Med. 2022;37(9):2259–66. DOI: https://doi.org/10.1007/s11606-022-07500-w
United States Department of Health and Human Services. HHS Action Plan to Reduce Racial and Ethnic Health Disparities: A Nation Free of Disparities in Health and Health Care. American Psychological Association. Available from: http://doi.apa.org/get-pe-doi.cfm?doi=10.1037/e553842012-001. Cited 2022 Sep 24.
2015 National Healthcare Quality and Disparities Report and 5th Anniversary Update on the National Quality Strategy. 2015. Available from: http://admin.ahrq.gov/research/findings/nhqrdr/nhqdr15/index.html. cited 2022 Sep 24
World Health Organization. Social determinants of health. WHO Regional Office for South-East Asia; 2008. Available from: https://www.who.int/health-topics/social-determinants-of-health#tab=tab_1
Nelson A. Unequal treatment: confronting racial and ethnic disparities in health care. J Natl Med Assoc. 2002;94(8):666–8.
De Lew N, Weinick RM. An Overview: Eliminating Racial, Ethnic, and SES Disparities in Health Care. Health Care Financ Rev. 2000;21(4):1–7.
McBean AM, Gornick M. Differences by race in the rates of procedures performed in hospitals for Medicare beneficiaries. Health Care Financ Rev. 1994;15(4):77–90.
Mustard CA, Mayer T, Black C, Postl B. Continuity of Pediatric Ambulatory Care in a Universally Insured Population. Pediatrics. 1996;98(6):1028–34. DOI: https://doi.org/10.1542/peds.98.6.1028
Schoendorf KC, Hogue CJR, Kleinman JC, Rowley D. Mortality among Infants of Black as Compared with White College-Educated Parents. N Engl J Med. 1992;326(23):1522–6. DOI: https://doi.org/10.1056/NEJM199206043262303
Centers for Disease Control and Prevention. Burden of Vision Loss | CDC. 2020. Available from: https://www.cdc.gov/visionhealth/risk/burden.htm. cited 2022 Dec 6.
Centers for Disease Control and Prevention (CDC). Prevalence of disabilities and associated health conditions among adults--United States, 1999. MMWR Morb Mortal Wkly Rep. 2001;50(7):120–5.
Assi L, Chamseddine F, Ibrahim P, Sabbagh H, Rosman L, Congdon N, et al. A Global Assessment of Eye Health and Quality of Life: A Systematic Review of Systematic Reviews. JAMA Ophthalmology. 2021;139(5):526–41. DOI: https://doi.org/10.1001/jamaophthalmol.2021.0146
Hamedani AG, VanderBeek BL, Willis AW. Blindness and Visual Impairment in the Medicare Population: Disparities and Association with Hip Fracture and Neuropsychiatric Outcomes. Ophthalmic Epidemiol. 2019;26(4):279–85. DOI: https://doi.org/10.1080/09286586.2019.1611879
Lange R, Kumagai A, Weiss S, Zaffke KB, Day S, Wicker D, et al. Vision-related quality of life in adults with severe peripheral vision loss: a qualitative interview study. J Patient Rep Outcomes. 2021;5(1):7. DOI: https://doi.org/10.1186/s41687-020-00281-y
Flaxman AD, Wittenborn JS, Robalik T, Gulia R, Gerzoff RB, Lundeen EA, Saaddine J, Rein DB; Vision and Eye Health Surveillance System study group. Prevalence of Visual Acuity Loss or Blindness in the US: A Bayesian Meta-analysis. JAMA Ophthalmol. 2021;139(7):717-723. DOI: https://doi.org/10.1001/jamaophthalmol.2021.0527
Kuo PL, Huang AR, Ehrlich JR, Kasper J, Lin FR, McKee MM, Reed NS, Swenor BK, Deal JA. Prevalence of Concurrent Functional Vision and Hearing Impairment and Association With Dementia in Community-Dwelling Medicare Beneficiaries. JAMA Netw Open. 2021;4(3):e211558. DOI: https://doi.org/10.1001/jamanetworkopen.2021.1558
Stevens GA, White RA, Flaxman SR, Price H, Jonas JB, Keeffe J, et al. Global Prevalence of Vision Impairment and Blindness: Magnitude and Temporal Trends, 1990–2010. Ophthalmology. 2013;120(12):2377–84. DOI: https://doi.org/10.1016/j.ophtha.2013.05.025
Centers for Disease Control and Prevention (CDC). 2018. Template Package 4. Available from: https://www.cdc.gov/index.htm. Cited 2024 Jun 28
Wittenborn JS, Zhang X, Feagan CW, Crouse WL, Shrestha S, Kemper AR, et al. The Economic Burden of Vision Loss and Eye Disorders among the United States Population Younger than 40 Years. Ophthalmology. 2013;120(9):1728–35. DOI: https://doi.org/10.1016/j.ophtha.2013.01.068
Halbert CH, Armstrong K, Gandy OH, Shaker L. Racial differences in trust in health care providers. Arch Intern Med. 2006;166(8):896–901. DOI: https://doi.org/10.1001/archinte.166.8.896
Zhang X, Cotch MF, Ryskulova A, Primo SA, Nair P, Chou CF, et al. Vision Health Disparities in the United States by Race/Ethnicity, Education, and Economic Status: Findings From Two Nationally Representative Surveys. Am J Ophthalmol. 2012;154(6, Suppl):S53-S62.e1 DOI: https://doi.org/10.1016/j.ajo.2011.08.045
Stein JD, Andrews C, Musch DC, Green C, Lee PP. Sight-Threatening Ocular Diseases Remain Underdiagnosed Among Children Of Less Affluent Families. Health Affairs. 2016;35(8):1359–66. DOI: https://doi.org/10.1377/hlthaff.2015.1007
Unzueta M, Globe D, Wu J, Paz S, Azen S, Varma R, et al. Compliance with recommendations for follow-up care in Latinos: the Los Angeles Latino Eye Study. Ethn Dis. 2004;14(2):285–91.
Cheng Q, Okoro CA, Mendez I, Lundeen EA, Saaddine JB, Stein R, et al. Health Care Access and Use Among Adults With and Without Vision Impairment: Behavioral Risk Factor Surveillance System, 2018. Prev Chronic Dis. 2022;19:E70. DOI: https://doi.org/10.5888/pcd19.220066
Harris MI, Klein R, Cowie CC, Rowland M, Byrd-Holt DD. Is the Risk of Diabetic Retinopathy Greater in Non-Hispanic Blacks and Mexican Americans Than in Non-Hispanic Whites With Type 2 Diabetes?: A U.S. population study. Diabetes Care. 1998;21(8):1230–5. DOI: https://doi.org/10.2337/diacare.21.8.1230
Klein R, Chou CF, Klein BEK, Zhang X, Meuer SM, Saaddine JB. Prevalence of Age-Related Macular Degeneration in the US Population. Archives of Ophthalmology. 2011;129(1):75–80 DOI: https://doi.org/10.1001/archophthalmol.2010.318
West SK, Munoz B, Schein OD, Duncan DD, Rubin GS. Racial Differences in Lens Opacities: The Salisbury Eye Evaluation (SEE) Project. American Journal of Epidemiology. 1998;148(11):1033–9. DOI: https://doi.org/10.1093/oxfordjournals.aje.a009579
Wang L, Zhu Z, Scheetz J, He M. Visual impairment and ten-year mortality: the Liwan Eye Study. Eye (Lond). 2021;35(8):2173–9. DOI: https://doi.org/10.1038/s41433-020-01226-x
Ehrlich JR, Ramke J, Macleod D, Burn H, Lee CN, Zhang JH, et al. Association between vision impairment and mortality: a systematic review and meta-analysis. The Lancet Global Health. 2021;9(4):e418–30. DOI: https://doi.org/10.1016/S2214-109X(20)30549-0
Choi HG, Lee MJ, Lee SM. Mortality and causes of death in a population with blindness in Korea: A longitudinal follow-up study using a national sample cohort. Sci Rep. 2020;10(1):4891. DOI: https://doi.org/10.1038/s41598-020-61805-6
Published
How to Cite
Issue
Section
Categories
License
Copyright (c) 2024 Angelica Garcia, Kent Anderson, Megan Funkhouser

This work is licensed under a Creative Commons Attribution 4.0 International License.
Authors who publish with this journal agree to the following terms:
- The Author retains copyright in the Work, where the term “Work” shall include all digital objects that may result in subsequent electronic publication or distribution.
- Upon acceptance of the Work, the author shall grant to the Publisher the right of first publication of the Work.
- The Author shall grant to the Publisher and its agents the nonexclusive perpetual right and license to publish, archive, and make accessible the Work in whole or in part in all forms of media now or hereafter known under a Creative Commons Attribution 4.0 International License or its equivalent, which, for the avoidance of doubt, allows others to copy, distribute, and transmit the Work under the following conditions:
- Attribution—other users must attribute the Work in the manner specified by the author as indicated on the journal Web site; with the understanding that the above condition can be waived with permission from the Author and that where the Work or any of its elements is in the public domain under applicable law, that status is in no way affected by the license.
- The Author is able to enter into separate, additional contractual arrangements for the nonexclusive distribution of the journal's published version of the Work (e.g., post it to an institutional repository or publish it in a book), as long as there is provided in the document an acknowledgment of its initial publication in this journal.
- Authors are permitted and encouraged to post online a prepublication manuscript (but not the Publisher’s final formatted PDF version of the Work) in institutional repositories or on their Websites prior to and during the submission process, as it can lead to productive exchanges, as well as earlier and greater citation of published work. Any such posting made before acceptance and publication of the Work shall be updated upon publication to include a reference to the Publisher-assigned DOI (Digital Object Identifier) and a link to the online abstract for the final published Work in the Journal.
- Upon Publisher’s request, the Author agrees to furnish promptly to Publisher, at the Author’s own expense, written evidence of the permissions, licenses, and consents for use of third-party material included within the Work, except as determined by Publisher to be covered by the principles of Fair Use.
- The Author represents and warrants that:
- the Work is the Author’s original work;
- the Author has not transferred, and will not transfer, exclusive rights in the Work to any third party;
- the Work is not pending review or under consideration by another publisher;
- the Work has not previously been published;
- the Work contains no misrepresentation or infringement of the Work or property of other authors or third parties; and
- the Work contains no libel, invasion of privacy, or other unlawful matter.
- The Author agrees to indemnify and hold Publisher harmless from the Author’s breach of the representations and warranties contained in Paragraph 6 above, as well as any claim or proceeding relating to Publisher’s use and publication of any content contained in the Work, including third-party content.
Enforcement of copyright
The IJMS takes the protection of copyright very seriously.
If the IJMS discovers that you have used its copyright materials in contravention of the license above, the IJMS may bring legal proceedings against you seeking reparation and an injunction to stop you using those materials. You could also be ordered to pay legal costs.
If you become aware of any use of the IJMS' copyright materials that contravenes or may contravene the license above, please report this by email to contact@ijms.org
Infringing material
If you become aware of any material on the website that you believe infringes your or any other person's copyright, please report this by email to contact@ijms.org